Ansoff Matrix and the Art of Not Staying Put
Why Strategic Growth Requires More Than Momentum
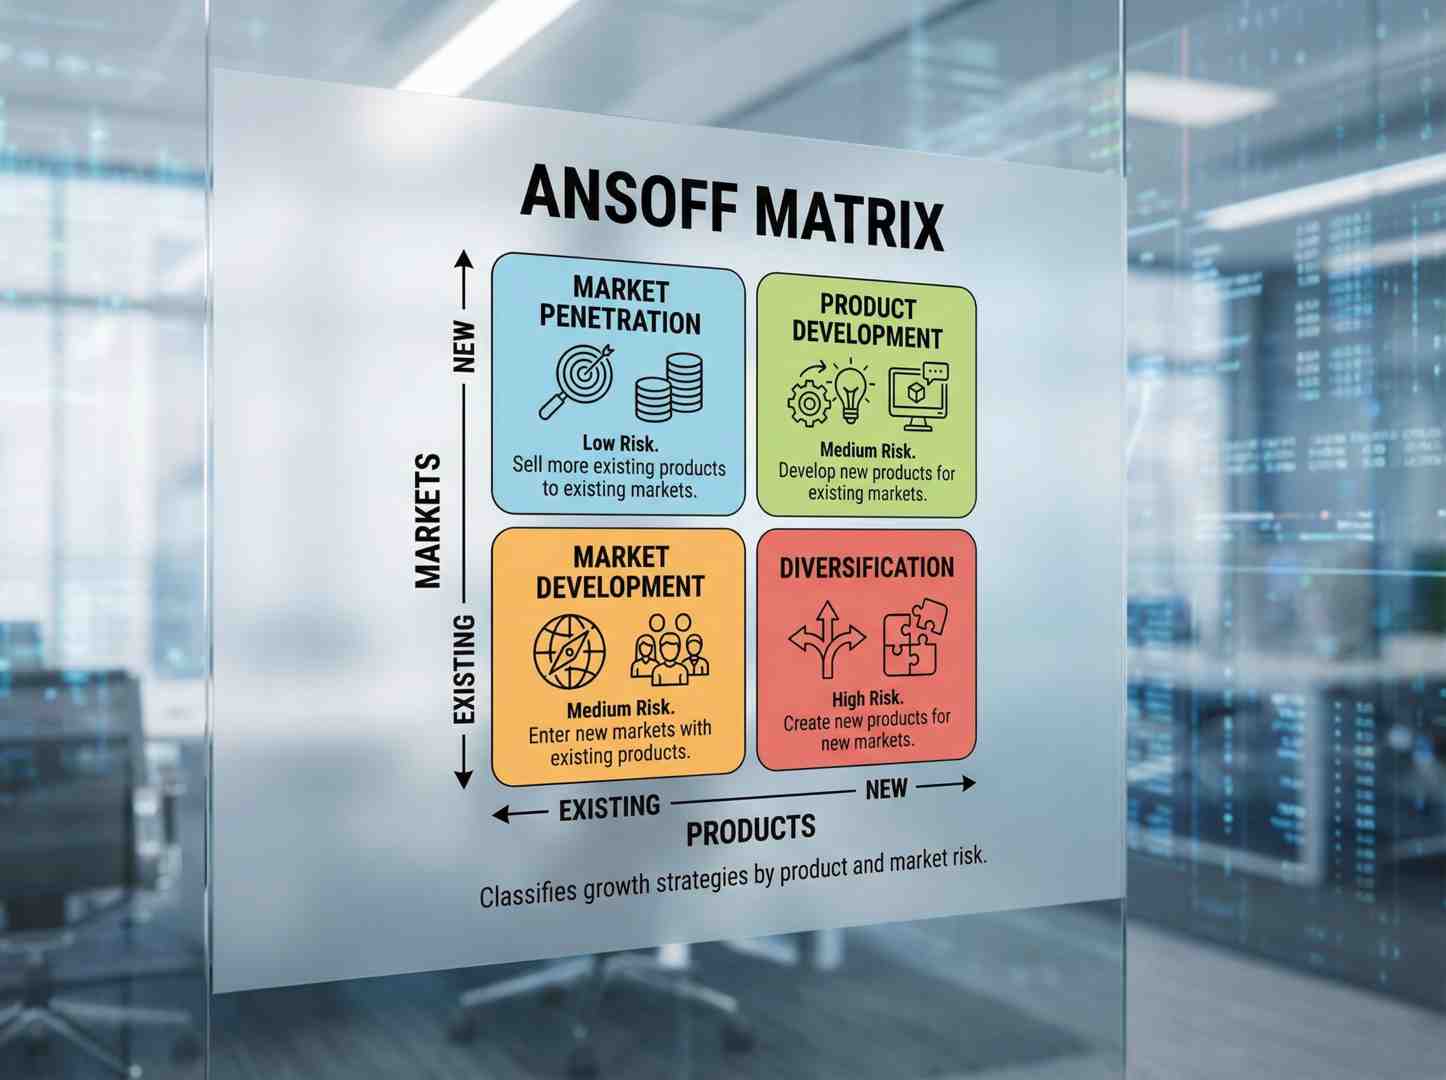
Ansoff matrix strategic planning provides a systematic framework for businesses to evaluate growth opportunities by mapping existing and new products against existing and new markets. The model identifies four primary growth strategies, each with distinct risk profiles:
| Growth Strategy | Product | Market | Risk Level |
|---|---|---|---|
| Market Penetration | Existing | Existing | Low |
| Product Development | New | Existing | Medium |
| Market Development | Existing | New | Medium |
| Diversification | New | New | High |
Few businesses that have stuck to their traditional products and markets have managed to grow in the long term. America’s most valued companies that made it to Forbes’s top ten were very different when compared across different eras. The companies that survived didn’t just optimize—they strategically expanded into adjacent territories using frameworks like the Ansoff Matrix.
The matrix itself is deceptively simple: a 2×2 grid that maps growth options based on whether you’re working with existing or new products and markets. But simplicity doesn’t mean easy. Each quadrant represents a fundamentally different risk profile, resource requirement, and execution challenge. Market penetration might seem safe, but it has hard limits. Diversification offers massive upside but demands capabilities most organizations don’t have.
What makes the Ansoff Matrix valuable isn’t the grid itself—it’s the discipline it enforces. It forces you to answer: Are we deepening existing strengths or building new ones? Are we serving known customers better or entering unfamiliar territory? The matrix won’t give you answers, but it will clarify the questions.
I’m Clayton Johnson, and I’ve used ansoff matrix strategic planning to help marketing leaders diagnose growth bottlenecks and build scalable demand systems that align strategic intent with measurable execution. The framework works best when integrated with entity authority modeling, competitive intelligence, and structured content architecture—not used in isolation.
, Product Development (new product, existing market, medium risk), Market Development (existing product, new market, medium risk), and Diversification (new product, new market, highest risk), with risk increasing diagonally from bottom-left to top-right - ansoff matrix strategic planning infographic hierarchy")
Ansoff matrix strategic planning terms made easy:
What is the Ansoff Matrix Strategic Planning Framework?
The Ansoff Matrix, also known as the “Product-Market Expansion Grid,” is a foundational tool used by executives and marketing leaders to determine their future direction. We use it to visualize the potential risks and rewards of different growth paths. At its core, the matrix is a risk management tool that helps us avoid the “complacency trap”—the dangerous assumption that what worked yesterday will keep working tomorrow.
The Origin of Ansoff Matrix Strategic Planning
The matrix was developed by H. Igor Ansoff, a Russian-American applied mathematician and business manager. He first introduced the concept in a seminal paper titled Strategies for Diversification published in the Harvard Business Review. Ansoff wasn’t just interested in growth for growth’s sake; he wanted to provide a strategic roadmap for firms to navigate the complexities of modern business management.
Before Ansoff, many businesses approached growth haphazardly. His work brought mathematical rigor to corporate strategy, helping us understand that “newness” in products or markets fundamentally changes the risk profile of a business. Today, it remains one of the most widely used tools in strategic planning, often serving as the starting point for our SEO and content marketing services.
Understanding the 2×2 Grid
The matrix is organized along two axes: Products (what you sell) and Markets (who you sell to). Both axes are divided into “Existing” and “New.” This creates four distinct quadrants:
- Market Penetration: Selling more of your current products to your current customers.
- Product Development: Creating new products for your current customers.
- Market Development: Taking your current products into entirely new markets or customer segments.
- Diversification: Creating new products for entirely new markets.
Each move away from the “Existing/Existing” quadrant increases the level of uncertainty. We can visualize this risk as a diagonal line moving from the bottom-left to the top-right of the grid.
The Four Quadrants: Navigating Growth and Risk
Understanding the nuances of each quadrant is essential for potential risk factors assessment. Let’s break down how each strategy works in practice.
Market Penetration: The Low-Risk Foundation
Market penetration is the “safest” strategy because it leverages what you already know. You are selling existing products to an existing market. The goal here is to increase your market share.
How do we do this? Usually through aggressive marketing, refined pricing strategies, or improving product quality. A classic example is Under Armour. To increase its market share, the company increased spending on endorsements and advertisements by 35%. This included signing professional basketball player Stephen Curry to launch the Curry Brand, which resulted in footwear growth of almost 95%.
By focusing on market penetration, you can use Miro’s chart feature to visualize where your sales are coming from and identify untapped pockets within your current audience.
Product Development: Innovating for Current Customers
Product development involves staying within your known market but introducing something new. This is a medium-risk strategy because while you understand the customer, the product itself is unproven.
Success here often relies on heavy R&D and active customer feedback. Apple is a master of this. While they weren’t the first to make a smartwatch, they used a “follower” strategy to enter the wearable market. By leveraging their existing iPhone user base, Apple sold over 4.2 million Apple Watch units in just one quarter following its launch.
Market Development: Finding New Frontiers
Market development is about taking your current success and moving it elsewhere. This could mean geographic expansion (opening in a new country) or targeting a new customer segment (moving from B2C to B2B).
Nike has excelled at this by riding the wave of the “athleisure” trend. The worldwide athleisure market size is anticipated to reach USD 662.56 billion in the coming years. By repositioning athletic gear as everyday fashion, Nike reached millions of customers who aren’t necessarily “athletes.”
However, this path is fraught with danger. Walmart’s attempt at market development in Germany resulted in a $1 billion loss because they failed to adapt to local regulations and cultural shopping habits before eventually exiting the market.
Diversification: The High-Stakes Leap
Diversification is the riskiest quadrant because you are moving into both new products and new markets simultaneously. You have no “home field advantage” here.
- Related Diversification: Moving into an industry that shares some commonalities with your current business (e.g., a car manufacturer starting to make motorcycles).
- Unrelated Diversification: Moving into a completely different field. Berkshire Hathaway is the king of this, owning controlling stakes in businesses across 35 unrelated sectors.
When it fails, it fails big. Richard Branson’s Virgin Cola only achieved a 3% market share in the UK before disappearing, proving that even a massive brand name isn’t enough to guarantee success in an unfamiliar, highly competitive market.
Advanced Applications: The 9-Box Matrix and Strategic Integration
While the 2×2 grid is great for high-level discussion, sophisticated marketers often need more nuance. This is where the 9-box version of the matrix comes in. It adds a middle category for “Modified” products and “Expanded” markets.
Enhancing Ansoff Matrix Strategic Planning with the 9-Box Model
The 9-box model allows for a more granular analysis. Instead of just “New” or “Existing,” we can look at:
- Product Extensions: Tweaking an existing product (like a new flavor of chips).
- Geographic Expansion: Moving into a neighboring state versus a new continent.
This helps us balance the risk-reward ratio more effectively. It prevents us from misclassifying a minor product update as a high-risk “New Product” strategy.
Integrating External Frameworks
The Ansoff Matrix shouldn’t live in a vacuum. To get the “big picture,” we integrate it with other diagnostic tools:
- PEST Analysis: Helps us understand the Political, Economic, Social, and Technological factors that might influence a new market entry.
- Porter’s Five Forces: Essential for analyzing the competitive intensity of a new industry.
- SWOT Analysis: Helps us determine if we actually have the internal strengths to pull off a diversification move.
By combining these, we can establish the right marketing mix for our specific growth stage.
How to Implement Ansoff Matrix Strategic Planning Step-by-Step

Ready to put this into practice? We recommend using collaboration tools to get your whole team aligned. Here is our three-step process for implementing ansoff matrix strategic planning.
Step 1: Identify Current Position
Before looking forward, look at where you are. Document your existing products, current market share, and primary customer segments. This is a great time to share your screens and review your analytics data.
Ask your team:
- Which products are our “cash cows”?
- Who is our “ideal customer profile” (ICP) right now?
- What is our current penetration rate in our primary market?
Step 2: Evaluate Growth Options
Now, brainstorm ideas for each quadrant. Don’t censor yourselves yet—just get the ideas on the board. Once you have a list, perform a capability audit. Do you have the tech stack, human capital, and budget to pursue these?

Use Miro’s ability to add comments to tag subject matter experts on specific ideas. For every high-risk idea, you must outline a contingency plan.
Step 3: Select and Execute
Choose the strategy that best aligns with your long-term vision. For many businesses, it’s wise to focus on no more than two quadrants at once.
HubSpot is a fantastic example of successful execution. They diversified from a simple platform for small businesses (600 customers in their early stages) to an all-in-one CRM with over 121,000 global customers today. They didn’t do this overnight; they systematically moved through product development and market development phases.
Frequently Asked Questions about Ansoff Matrix Strategic Planning
When is the best time to use the Ansoff Matrix?
We recommend using it at least once a year during annual planning. However, if recent history has taught us anything, it’s that the marketplace can change without warning. If you’re facing a pandemic, an economic shift, or a disruptive new competitor, it’s time to pull out the matrix and evaluate a strategic pivot.
What are the main limitations of the Ansoff Matrix?
The biggest criticism is that it’s a bit of an “isolationist” tool. It doesn’t explicitly account for what your competitors are doing. It also focuses heavily on risk without providing a standard way to measure the reward. You might find a low-risk market penetration strategy that has such a small payoff it’s not worth the effort.
How does the matrix help with risk management?
It forces a move away from “gut feeling” toward structured analysis. By categorizing a move as “Diversification,” you automatically trigger a higher level of due diligence and contingency mapping. It helps us maintain a balanced portfolio—ensuring we aren’t putting all our eggs in the high-risk diversification basket.
Conclusion
Growth isn’t an accident; it’s an architecture. Using ansoff matrix strategic planning allows us to stop “staying put” and start moving with intention. Whether you are deepening your hold on your current market or taking a bold leap into a new industry, the matrix provides the structure needed to manage the journey.
At Demandflow.ai, we believe that clarity leads to structure, and structure leads to leverage. We don’t just provide tactics; we help founders and marketing leaders build a growth operating system. By combining actionable frameworks like the Ansoff Matrix with taxonomy-driven SEO and competitive positioning, we create authority-building ecosystems that drive compounding growth.
Ready to stop guessing and start scaling? Let’s build your growth architecture together.