Financial & Value Metrics: Terms Demystified
Financial & Value Metrics are the quantitative indicators that measure your company’s performance, health, and long-term viability. Whether you’re evaluating profitability, liquidity, efficiency, or valuation, these metrics help you make informed decisions about operations, investments, and strategy.
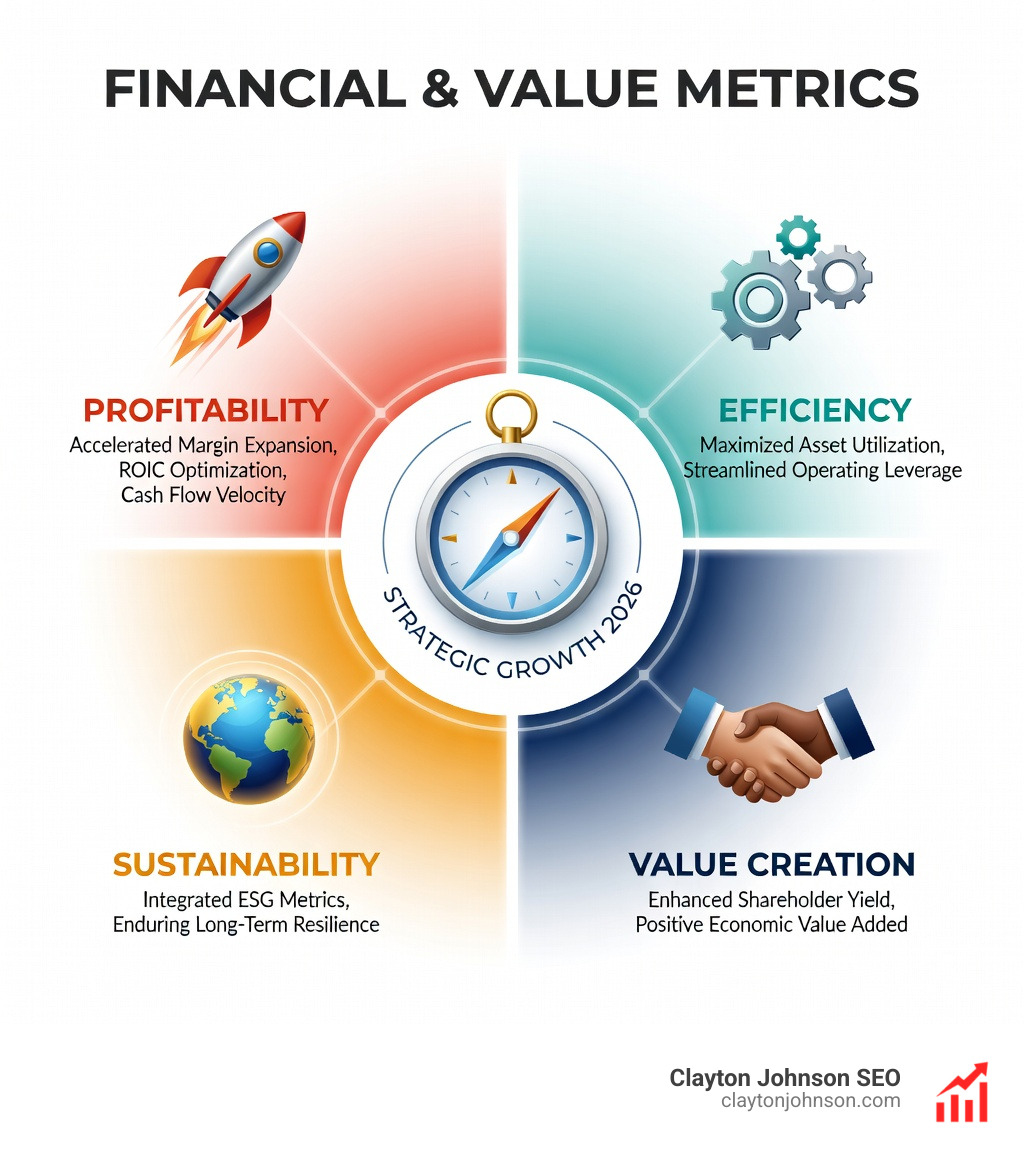
Key categories of Financial & Value Metrics:
- Profitability metrics — Gross margin, net profit margin, EBITDA, ROE, ROA
- Liquidity metrics — Current ratio, quick ratio, working capital, cash conversion cycle
- Efficiency metrics — Inventory turnover, asset turnover, accounts receivable turnover
- Solvency metrics — Debt-to-equity ratio, interest coverage, debt-to-assets
- Valuation metrics — P/E ratio, P/B ratio, PEG ratio, free cash flow, enterprise value
Most businesses track dozens of metrics, but only a handful drive real decisions. Revenue, net profit, and burn rate are the top three financial metrics critical at every stage—from startup to maturity. The challenge isn’t just calculating these numbers. It’s understanding which metrics matter for your business model, lifecycle stage, and industry context.
A software company with a P/E ratio of 40 isn’t overvalued if growth justifies it. A manufacturer with a debt-to-equity ratio of 1.5 isn’t overleveraged if it’s capital-intensive by nature. Context matters. Trends matter. And combining metrics—rather than relying on one—gives you a complete picture.
As Benjamin Graham noted after the 1929 crash, value investing is about finding stocks trading below their intrinsic value based on fundamentals. That same principle applies internally: understanding your own metrics helps you create value, not just measure it. Companies that grow profitably earn returns above their cost of capital. Those that don’t eventually face a reckoning.
This guide breaks down the essential Financial & Value Metrics across profitability, liquidity, efficiency, solvency, and valuation. You’ll learn how to interpret them in context, avoid common pitfalls, and use them to drive strategic decisions—not just report on the past.
I’m Clayton Johnson, and I’ve spent years building SEO and growth systems that rely on clear, measurable outcomes. Understanding Financial & Value Metrics isn’t just a finance exercise—it’s foundational to diagnosing growth problems, prioritizing initiatives, and building sustainable competitive advantage. Let’s demystify the metrics that actually matter.
, Liquidity metrics (current ratio, quick ratio, working capital), Efficiency metrics (inventory turnover, asset turnover, receivables turnover), Solvency metrics (debt-to-equity, interest coverage, debt-to-assets), and Valuation metrics (P/E ratio, P/B ratio, PEG ratio, free cash flow, enterprise value), with formulas and benchmarks for each category - Financial & Value Metrics infographic infographic-line-5-steps-blues-accent_colors")
Core Financial & Value Metrics for Business Health
When we sit down with founders in Minneapolis or growth leaders across the country, we often find that “data overload” is the biggest hurdle. You don’t need a thousand data points; you need the right ones. To understand the baseline health of any organization, we look at three primary pillars: Revenue, Net Profit, and Burn Rate.
The “Big Three” Metrics
- Revenue (The Top Line): This is the total amount of money brought in by your business activities. It’s the “top line” because it sits at the very top of your income statement. While high revenue is great, it doesn’t tell the whole story. As the saying goes, “Revenue is vanity, profit is sanity.”
- Net Profit (The Bottom Line): This is what remains after all operating expenses, interest, taxes, and preferred stock dividends have been subtracted from total revenue. It is the ultimate measure of a company’s ability to generate wealth for its owners.
- Burn Rate: For startups and growth-stage companies, the burn rate is the speed at which you are spending your cash reserves. Specifically, Net Burn is the monthly cash loss. Knowing your burn rate allows you to calculate your Runway—how many months you can survive before you need to become profitable or raise more capital.

Understanding these metrics requires a deep-dive into BMC cost structure and expense management, as your fixed and variable costs directly dictate how much revenue you need to reach “default alive” status.
Core Business Metrics List
- Gross Profit: Revenue minus Cost of Goods Sold (COGS).
- Operating Cash Flow: The cash generated from core business operations. Operating cash flow is a vital measure of whether a business can sustain itself without external financing.
- Working Capital: Current Assets minus Current Liabilities. It tells us if we have enough “fuel” to keep the lights on in the short term.
Contextualizing Financial & Value Metrics by Industry
A “good” number in one industry can be a disaster in another. For instance, Software/SaaS companies typically boast high gross margins of 75-85%. Because they are highly scalable, they often trade at premium P/E ratios of 30-50.
Conversely, Manufacturing companies often have moderate gross margins (25-40%) and higher Debt-to-Equity (D/E) ratios (1.0-2.0) because they require significant investment in machinery and factories. If you’re building a tech firm, you might use the definitive BMC tech startup template for scalable growth to ensure your business model aligns with these industry benchmarks.
- Banking: Typically trades at lower P/E ratios (10-15) compared to tech.
- Retail: Operates on thin operating margins (3-8%) but relies on high volume.
- Financial Services: Often targets a Return on Equity (ROE) of 12-18%.
The lifecycle stage also matters. A Startup focuses on CAC (Customer Acquisition Cost) and LTV (Lifetime Value), while a Mature company focuses on EPS (Earnings Per Share) and Dividend Yield.
Top KPIs for Profitability, Liquidity, and Efficiency
If the “Big Three” are the heartbeat, these KPIs are the blood pressure and cholesterol levels of your business. They tell us how the money is being made and how efficiently the machine is running.
Profitability Ratios: Is the Juice Worth the Squeeze?
Profitability metrics are often considered the most important measures of financial health.
- Gross Margin: (Revenue – COGS) / Revenue. It shows the percentage of each dollar that remains to cover operating expenses.
- Operating Margin: This measures how much profit a company makes on a dollar of sales after paying for variable costs of production, such as wages and raw materials, but before paying interest or tax.
- EBITDA: Earnings Before Interest, Taxes, Depreciation, and Amortization. It’s a popular proxy for operating cash flow.
Liquidity Ratios: Can You Pay the Bills?
Liquidity measures your ability to meet short-term obligations.
- Current Ratio: Current Assets / Current Liabilities. A ratio above 1.0 is generally healthy.
- Quick Ratio (Acid Test): This is a more conservative measure. It excludes inventory from assets because inventory can’t always be turned into cash quickly. A quick ratio lower than 1.0 is often a warning sign.
For a deeper dive into these formulas, check out this Guide to Financial Ratios.
Comparing Liquidity vs. Solvency
| Feature | Liquidity | Solvency |
|---|---|---|
| Focus | Short-term obligations | Long-term stability |
| Key Metric | Current Ratio / Quick Ratio | Debt-to-Equity / Interest Coverage |
| Goal | Having enough cash for today | Having a sustainable capital structure |
| Risk | Technical insolvency (can’t pay bills) | Bankruptcy (liabilities > assets) |
Analyzing Operational Efficiency and Solvency
Efficiency metrics show how well you use your assets. If you have $1 million in inventory sitting in a warehouse in Minneapolis for six months, that’s “dead money.”
- Inventory Turnover: How many times a company has sold and replaced inventory during a specific period. Higher is usually better.
- Accounts Receivable Turnover: How quickly you collect payments from customers.
- Asset Turnover: Total Sales / Average Total Assets. This shows how much revenue you generate for every dollar tied up in assets.
- SG&A Ratio: (Selling, General, and Administrative expenses) / Net Sales. This helps monitor overhead. Outsourcing SG&A activities can often lead to a 5-10% cost reduction.
Solvency is about the long haul. The Debt-to-Equity (D/E) ratio is a staple here. Capital-intensive industries like utilities typically operate with D/E ratios above 1.5, while tech companies often stay below 0.5.
Valuation Metrics: Identifying Undervalued Assets
For investors and founders looking toward an exit, valuation metrics are the “price tags” of the business world. They help determine if a stock is a bargain or a bubble.
- P/E Ratio (Price-to-Earnings): The most common metric. It compares share price to earnings per share. A high P/E might mean a stock is overvalued, or it might mean investors expect high growth.
- P/B Ratio (Price-to-Book): Compares market value to book value. A P/B ratio under 1.0 (like 0.5 or 0.8) can signal an undervalued company—or one with serious fundamental flaws.
- PEG Ratio (Price/Earnings-to-Growth): This refines the P/E ratio by factoring in earnings growth. A PEG ratio below 1.0 is often considered “undervalued” relative to its growth potential.
- Free Cash Flow (FCF): This is the cash a company generates after accounting for cash outflows to support operations and maintain its capital assets. FCF is the “gold standard” for value investors because, unlike earnings, it’s harder to manipulate with accounting tricks.
To get a handle on the basics, read through Understanding Key Stock Market Metrics.
Using Financial & Value Metrics for Investment Decisions
When we look at Financial & Value Metrics for investment, we are performing “Fundamental Analysis.” This involves looking at a company’s intrinsic value rather than just its current stock price.
- ROI (Return on Investment): The most basic measure of a “good” deal. However, ROI can be manipulated by excluding certain costs, so always check the math!
- EPS (Earnings Per Share): This tells you how much profit is allocated to each outstanding share of common stock.
- CAGR (Compound Annual Growth Rate): This smooths out the “bumps” in growth over time, showing you the mean annual growth rate. It’s perfect for evaluating long-term performance without getting distracted by one bad quarter.
Measuring Value Creation and Economic Profit
Value creation isn’t just about making money; it’s about making more money than the cost of the capital you used. This is the difference between “accounting profit” and “economic profit.”
The ROIC vs. WACC Framework
A company creates true value when its Return on Invested Capital (ROIC) is higher than its Weighted Average Cost of Capital (WACC).
- WACC: The average rate a company pays to finance its assets (debt and equity).
- Economic Profit: Invested Capital x (ROIC – WACC).
If your WACC is 10% and your ROIC is 8%, you are technically destroying value, even if your net profit looks positive on paper!
Key Value Creation Drivers
- Pricing Strategy: Even a small change here can lead to a 2-6% revenue enhancement.
- Supply Chain Optimization: Can lead to 2-4% cost savings.
- Capital Allocation: Choosing which projects to fund based on their potential to exceed the WACC.
Prioritizing Value Creation Initiatives
How do you decide what to fix first? We recommend an analytics-led approach using a “Value Driver Tree.” This breaks down complex goals into manageable parts. You can prioritize initiatives based on:
- EBITDA Impact: How much will this move the needle on profit?
- Implementation Complexity: Is this a quick win or a three-year overhaul?
- Business Risk: What happens if this fails?
Using a “self-funding” approach—where cash released from early efficiency wins funds later growth initiatives—is a smart way to manage this transition.
Frequently Asked Questions about Financial Metrics
What are the common pitfalls in interpreting financial metrics?
The biggest mistake is ignoring Industry Context. Comparing the P/E of a Minneapolis-based bank to a Silicon Valley AI startup is like comparing apples to spaceships. Another pitfall is ignoring Trends. A high Current Ratio is good, but if it’s been dropping for six straight months, that’s a red flag. Finally, watch out for Management Manipulation. Ratios can be “dressed up” near the end of a fiscal year to look more attractive to lenders.
How do macroeconomic conditions impact value creation?
External factors like interest rates and inflation directly impact your Cost of Capital (WACC). When interest rates rise, the cost of debt increases, making it harder for projects to achieve a positive economic profit. Macroeconomic volatility also impacts Market Expectations, which can lead to a “treadmill effect” where a company must grow faster just to maintain its current share price. In our local Minneapolis market, we often look at the Regional Economic Indicators from the Federal Reserve Bank of Minneapolis to gauge these shifts.
What tools best support tracking and automating financial KPIs?
Manual spreadsheets are the enemy of accuracy. Modern businesses use:
- Real-time Dashboards: To visualize KPIs like burn rate and gross margin daily.
- ERP Integration: Tools like NetSuite or Sage Intacct automate the collection of data from different departments.
- AI Financial Modeling: For predictive analytics and “what-if” scenario planning.
- Automated Reporting: To ensure stakeholders get consistent, unbiased data every week.
Conclusion
Mastering Financial & Value Metrics is the difference between guessing and growing. Whether you are a founder trying to extend your runway or an investor looking for the next undervalued gem, these numbers provide the map.
At Clayton Johnson SEO, we believe that financial literacy is the backbone of any successful growth strategy. We provide the actionable frameworks and interactive tools you need to diagnose growth problems and execute with measurable results. From SEO strategy to analytics and data services, our goal is to help you build a business that doesn’t just look good on a dashboard—it creates real, lasting value.
If you’re ready to stop drowning in data and start driving results, let’s look at the metrics that matter for your specific stage and sector. Growth is a science, and we’ve got the lab ready.