Defining the McKinsey matrix portfolio strategy
McKinsey matrix portfolio strategy is a nine-box framework that helps multi-business corporations prioritize investment by evaluating Strategic Business Units (SBUs) on two dimensions: industry attractiveness and competitive strength. Unlike simpler models, it uses weighted criteria to guide decisions about where to invest, hold, or divest.
Quick reference:
| Matrix Position | Strategic Posture | Action |
|---|---|---|
| High Attractiveness / High Strength | Invest/Grow | Allocate capital aggressively |
| Medium Attractiveness / Medium Strength | Selectivity/Earnings | Invest selectively after green zones |
| Low Attractiveness / Low Strength | Harvest/Divest | Minimize investment or exit |
Key components:
- Y-Axis (Industry Attractiveness): Market size, growth rate, profitability, competitive intensity, regulatory outlook
- X-Axis (Business Unit Strength): Market share, brand equity, cost position, innovation capacity, distribution strength
- Nine cells: Color-coded zones guide capital allocation decisions
Most corporations struggle with resource allocation across diverse business units. The McKinsey matrix portfolio strategy solves this by replacing gut instinct with structured, evidence-based prioritization. Developed by McKinsey & Company for General Electric in the 1970s, the framework remains relevant because it adapts to any industry through customizable criteria and weighting.
The matrix addresses three core questions:
- Which business units deserve incremental capital?
- Where should we harvest cash to fund growth elsewhere?
- What assets no longer fit our strategic future?
Modern applications extend beyond conglomerates. PE platforms use it to evaluate segment bets. Tech companies apply it to product portfolios. B2B firms deploy it for market prioritization. The framework’s durability stems from its flexibility—you choose criteria that reflect your value drivers, not generic proxies like market share alone.
Why it matters now:
Markets circulate faster through matrix quadrants than they used to. The average time any business unit spends in a single cell has shortened significantly in fast-moving industries. Cash cow life cycles have also declined in many categories. This acceleration makes disciplined portfolio management more critical, not less.
The matrix isn’t a mechanical answer—it’s a decision aid that must integrate with financial modeling, scenario analysis, and capability plans. But when embedded properly, it transforms portfolio reviews from political negotiations into evidence-backed strategic conversations.
I’m Clayton Johnson, and I’ve spent the past decade helping B2B companies architect growth systems that compound. I apply the McKinsey matrix portfolio strategy to help founders and marketing leaders diagnose where to concentrate effort, which initiatives to prune, and how to structure demand engines that scale predictably.
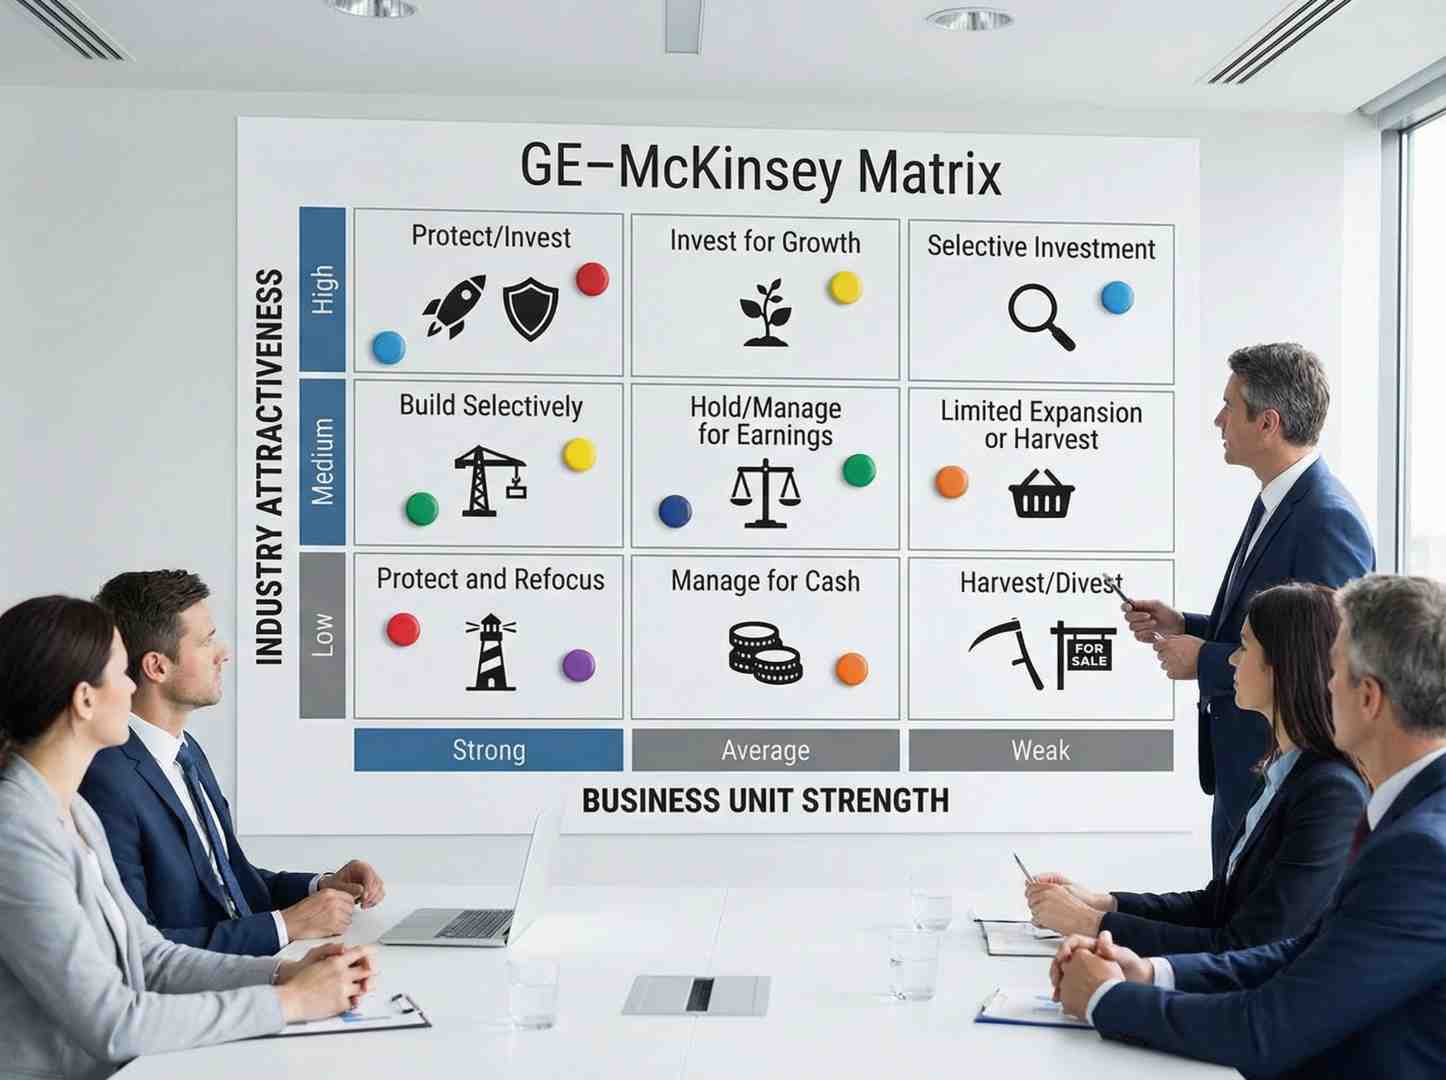
 and Business Unit Strength on the X-axis (High, Medium, Low), with nine cells color-coded green (Invest/Grow), yellow (Selectivity/Earnings), and red (Harvest/Divest), including bubble size representing revenue and directional arrows showing projected movement - McKinsey matrix portfolio strategy infographic")
At its core, the McKinsey matrix portfolio strategy (also known as the GE-McKinsey Nine-Box Matrix) is a visualization tool. It maps out where a company’s various businesses stand in relation to each other. In a world of limited capital, we cannot be everything to everyone. We must choose where to play and how to win.
This matrix is an evolution of earlier strategic thinking. Companies began to realize that managing a conglomerate required more than just looking at the bottom line of each division. They needed a way to compare a software division with a heavy machinery division on equal footing.
Core Components of the McKinsey matrix portfolio strategy
To master this strategy, we must understand its four pillars:
- Industry Attractiveness: This is the external view. Is this a “good” neighborhood to be in? We look at market growth, profit pools, and barriers to entry.
- Competitive Strength: This is the internal view. Are we the “best” house in that neighborhood? We look at our market share, our brand power, and our unique IP.
- Strategic Postures: Based on where an SBU lands, the matrix suggests a posture: Invest, Protect, or Harvest.
- Investment Prioritization: This is the “so what.” The matrix dictates how we slice the capital expenditure (CapEx) pie.
Origins and Evolution of the Nine-Box Grid
The matrix was born out of necessity. When General Electric (GE) had a portfolio so complex that the standard BCG 2×2 matrix—which only looked at market growth and market share—wasn’t cutting it, GE commissioned McKinsey & Company to build a more sophisticated “Business Screen.”
The result was a 3×3 grid that allowed for more nuance. Instead of just “High” or “Low” growth, you had “Medium.” Instead of just market share, you had a composite of competitive factors. This allowed GE to spot “Stars” that were hidden in average-growth markets but where GE had an overwhelming advantage.
For modern businesses, this level of detail is essential. Whether you are looking for SEO consultant services to boost your digital strength or restructuring a global manufacturing firm, the logic remains the same: align your resources with the highest potential for value creation.
BCG Matrix vs McKinsey Matrix: A Quick Comparison
| Feature | BCG Matrix | GE-McKinsey Matrix |
|---|---|---|
| Grid Size | 2×2 (4 cells) | 3×3 (9 cells) |
| Axes | Market Growth & Relative Share | Industry Attractiveness & Unit Strength |
| Complexity | Low (Single factor per axis) | High (Multi-factor weighted scores) |
| Strategy Focus | Cash flow management | Long-term ROI and strategic fit |
The Two Pillars: Industry Attractiveness and Competitive Strength
The magic of the McKinsey matrix portfolio strategy lies in how we define its two axes. We don’t just guess; we use a structured growth architecture to score them. Think of it like a credit score for your business units—it needs to be objective, data-driven, and transparent.
If you’re interested in diving deeper into the technical side of business strategy, check out the consulting industry foundations for more in-depth knowledge on how these frameworks are applied at the highest levels of management.
Measuring Industry Attractiveness (Y-Axis)
Industry attractiveness answers the question: “If we were the market leader here, would we actually make money?” We evaluate this using several lenses:
- Market Size and Growth Rate: Large, fast-growing markets are naturally more attractive, but growth isn’t everything.
- Profitability Trends: Is the industry’s profit pool expanding or shrinking?
- Porter’s Five Forces: We look at the power of buyers and suppliers, the threat of new entrants, and the intensity of rivalry.
- PESTLE Factors: How do political, economic, social, technological, legal, and environmental trends impact the long-term outlook?
- Pricing Trends: Are prices stable, or is there a “race to the bottom”?
Assessing Business Unit Strength (X-Axis)
Competitive strength is about your specific SBU’s ability to outperform rivals. It’s not just about who is biggest; it’s about who is best positioned to defend their turf.
- Market Share and Momentum: Are you gaining or losing ground?
- Brand Equity: Does your brand allow for premium pricing?
- VRIO Resources: Do you have resources that are Valuable, Rare, Inimitable, and Organized to capture value?
- Customer Loyalty: What is your Net Promoter Score (NPS) or retention rate?
- Value Chain Strength: Do you have a cost advantage in production or a superior distribution network?
Strategic Postures: Navigating the Nine Cells
Once we plot our SBUs, they will land in one of three color-coded zones. Each zone demands a different mindset.
, Yellow (Hold/Select), and Red (Harvest/Exit) - McKinsey matrix portfolio strategy")
Maximizing ROI with the McKinsey matrix portfolio strategy
The Green Zone (top-left) is where your “Stars” live. These are business units in highly attractive industries where you have a strong competitive advantage.
The Strategy: Invest and Grow.
In this zone, we don’t hold back. We allocate 40% or more of incremental capital here. We look for ways to build on our strengths, manage vulnerabilities, and potentially acquire smaller competitors to consolidate our lead.
A classic example from the streaming category shows this in action: an early, underweighted initiative can become a dominant growth engine when industry attractiveness is high and the company’s competitive advantages are durable.
Managing the Harvest and Divest Quadrants
The Red Zone (bottom-right) consists of “Dogs.” These are units in unattractive industries where you are also weak.
The Strategy: Harvest or Divest.
Here, the goal is to stop the bleeding. We minimize investment, cut costs, and squeeze out any remaining cash flow. If the unit is dragging down the corporate ROIC (Return on Invested Capital), we look for an exit.
- Internet Explorer: Once dominant, it eventually lost significant share as new browsers improved performance and security. Microsoft ultimately shifted it into a harvest strategy and directed innovation toward successor products.
- David Jones: In a difficult retail environment, the business faced sustained operational and portfolio challenges. The parent company responded with restructuring actions—including store closures and asset sales—to manage the decline.
Building Your Matrix: A Step-by-Step Implementation
Building a robust McKinsey matrix portfolio strategy isn’t an afternoon task. A directional version takes 3–5 weeks, while a robust version with triangulated benchmarks and ROIC modeling typically takes 6–10 weeks.
If you’re looking to align your digital assets with this kind of rigor, more info about SEO content marketing can help you treat your content categories as SBUs that need prioritization.
Step-by-Step Construction Guide
- Identify Strategic Business Units (SBUs): Define your units. Are they product lines, brands, or geographic regions?
- Select Evaluation Criteria: Choose 6–10 factors for each axis. Don’t overcomplicate it.
- Assign Weights: Not all factors are equal. In tech, “Innovation Velocity” might be weighted at 20%, while in utilities, “Regulatory Outlook” might take the lead.
- Calculate Scores: Rate each SBU on a scale of 1–5 for each criterion. Multiply by the weight to get a composite score.
- Plot Bubbles: Draw your 3×3 grid. The size of each bubble should represent the SBU’s revenue or profit contribution.
- Add Directional Arrows: This is crucial. Where will this SBU be in 2 years? Use arrows to show the “direction of travel.”

Integrating Complementary Frameworks
The Nine-Box Matrix is powerful, but it doesn’t work in a vacuum. We often pair it with:
- SWOT Analysis: To understand the specific “Why” behind a unit’s strength score.
- MACS Matrix: A McKinsey evolution that looks at a parent company’s ability to “extract value” from a unit. Sometimes a unit is attractive, but you aren’t the “natural owner” who can run it best.
- Scenario Sensitivity: What happens to the matrix if interest rates rise or a new competitor enters?
- Parenting Advantage: Does being part of your corporation actually help the SBU, or would it be worth more as a standalone company?
Frequently Asked Questions about the McKinsey Matrix
How does the McKinsey Matrix differ from the BCG Matrix?
The BCG Matrix is a 2×2 grid using only two variables: market growth and relative market share. The McKinsey matrix portfolio strategy is a 3×3 grid that uses multiple weighted factors to determine “Industry Attractiveness” and “Competitive Strength.” It’s like comparing a polaroid (BCG) to a high-definition 4K video (McKinsey).
When is the McKinsey Matrix most useful for a business?
It is most useful for multi-business corporations or companies with diverse product lines. It’s the “Gold Standard” for annual strategic planning, M&A screening, and resource allocation. If you find yourself arguing over which department gets more budget, you need this matrix.
How often should a company refresh its portfolio analysis?
For most corporations, an annual refresh is imperative. However, in volatile sectors like technology or AI-augmented marketing, reviewing the matrix every quarter may be warranted to capture rapid market shifts.
Conclusion
The McKinsey matrix portfolio strategy is more than just a chart; it is a discipline. It forces us to be honest about our weaknesses and realistic about the markets we choose to compete in. In an era of constant disruption, clarity is your greatest competitive advantage.
At Demandflow.ai, we believe that clarity comes from structure. Most companies don’t lack tactics; they lack a structured growth architecture. By using frameworks like the Nine-Box Matrix alongside taxonomy-driven SEO and competitive positioning models, we help you build a growth engine that doesn’t just run—it compounds.
Ready to stop guessing and start architecting your growth? Get started with SEO content marketing and let’s build your portfolio for the future.


")