Process Improvement & Scoring 101

Why Process Improvement & Scoring Matters
The Process Improvement & Scoring framework helps organizations fine-tune operations to achieve peak efficiency. When measuring the success of process improvement efforts, organizations often focus on these key scoring methods:
- KPI Tracking: Monitoring Key Performance Indicators like cycle time, defect rates, and resource utilization.
- Cost Savings: Quantifying financial benefits from reduced waste, rework, and operational expenses.
- Quality Metrics: Measuring improvements in product/service quality, error reduction, and customer satisfaction scores.
- Efficiency Gains: Assessing reductions in processing time, lead time, and increased throughput.
- Benchmarking: Comparing process performance against industry standards or internal best-in-class operations.
What you measure is what you get. This simple truth highlights why effective measurement is crucial. Companies often struggle with hidden inefficiencies that silently drain resources. In fact, many businesses lose between 20% and 30% of their revenue each year due to inefficient processes. This also translates to significant workforce time lost—up to 30% on unproductive tasks.
Applying Process Improvement & Scoring helps uncover these hidden problems. It provides a structured way to identify bottlenecks, streamline workflows, and boost overall productivity. By clearly defining how success is measured, organizations can make data-driven decisions that lead to lasting positive change. It’s about working smarter, not just harder, and ensuring every effort brings measurable value.
As Clayton Johnson, I’ve built scalable traffic systems and AI-augmented marketing workflows across industries, consistently focusing on how structured frameworks like Process Improvement & Scoring drive measurable outcomes for growth. My expertise lies in turning fragmented efforts into coherent growth engines.

The Fundamentals of Process Improvement & Scoring

At its heart, Process Improvement & Scoring is about the systematic identification, analysis, and enhancement of existing business processes. It isn’t just a one-time “fix-it” project; it’s a discipline. Think of it like fine-tuning a high-performance engine. You aren’t necessarily replacing the car, but you are adjusting the timing, the fuel mix, and the exhaust to ensure every ounce of energy translates into forward motion.
The stakes are higher than most realize. Studies show that lose between 20% and 30% revenue each year is a common reality for companies plagued by instability. When we talk about operational-aligment, we are talking about ensuring that your daily activities actually support your strategic goals. Without this alignment, you’re just busy—not productive.
Furthermore, inefficient processes act as a “tax” on your talent. Businesses lose up to 30% of workforce time to unproductive tasks like unnecessary meetings or manual data entry that should have been automated years ago. By mastering Process Improvement & Scoring, you create a “competitive moat.” While your competitors are bogged down in bureaucratic mud, your organization becomes agile, data-driven, and capable of scaling without the usual growing pains.
Distinguishing PI, BPI, and BPM
It’s easy to get lost in the alphabet soup of corporate terminology, but the distinctions between Process Improvement (PI), Business Process Improvement (BPI), and Business Process Management (BPM) are vital for choosing the right approach.
- Process Improvement (PI): This is the granular level. It focuses on enhancing specific, individual workflows—like how a team handles customer support tickets or how a factory line assembles a single part.
- Business Process Improvement (BPI): This takes a broader view, targeting core, customer-facing, and revenue-generating processes. It often involves cross-functional teams and looks at the “big picture” of how value is delivered to the client.
- Business Process Management (BPM): This is the overarching discipline. It involves the ongoing management, modeling, execution, and monitoring of all organizational processes.
Understanding where you are on this spectrum helps in creating execution-roadmaps-operational-alignment that actually work for your specific business stage.
Choosing the Right Process Improvement & Scoring Methodology
Not every problem requires a radical redesign. Choosing the right path depends on three main factors:
- Goal Alignment: Are you trying to eliminate defects (Six Sigma), remove waste (Lean), or foster a culture of tiny, daily wins (Kaizen)?
- Resource Availability: Do you have the budget for a massive overhaul, or do you need “soft savings” generated by recovered employee time?
- Organizational Culture: Is your team ready for a “Business Process Reengineering” (BPR) shock, or would they thrive better with incremental PDCA cycles?
Methodologies and Tools for Operational Excellence

The “how” of Process Improvement & Scoring is found in established methodologies. These aren’t just theories; they are battle-tested frameworks used by the world’s most successful organizations.
- Six Sigma: developed by Motorola in 1986, this methodology focuses on reducing variability. The goal is near-perfection: fewer than 3.4 defects per million opportunities.
- Lean Manufacturing: Originating from the Toyota Production System (TPS), Lean is obsessed with eliminating “muda” (waste). It’s how Toyota managed to cut production time by 50% while reducing inventory costs by 75%.
- Kaizen: This is the philosophy of continuous, incremental improvement. It suggests that small changes—like a 1% improvement every day—lead to massive results over time.
- PDCA Cycle: Plan-Do-Check-Act. This is the scientific method applied to business. You plan a change, do a small test, check the results, and act on what you learned.
- Theory of Constraints (TOC): This methodology focuses on the “bottleneck.” It assumes every system has one specific constraint that limits throughput. If you aren’t fixing the bottleneck, you aren’t actually improving the system.
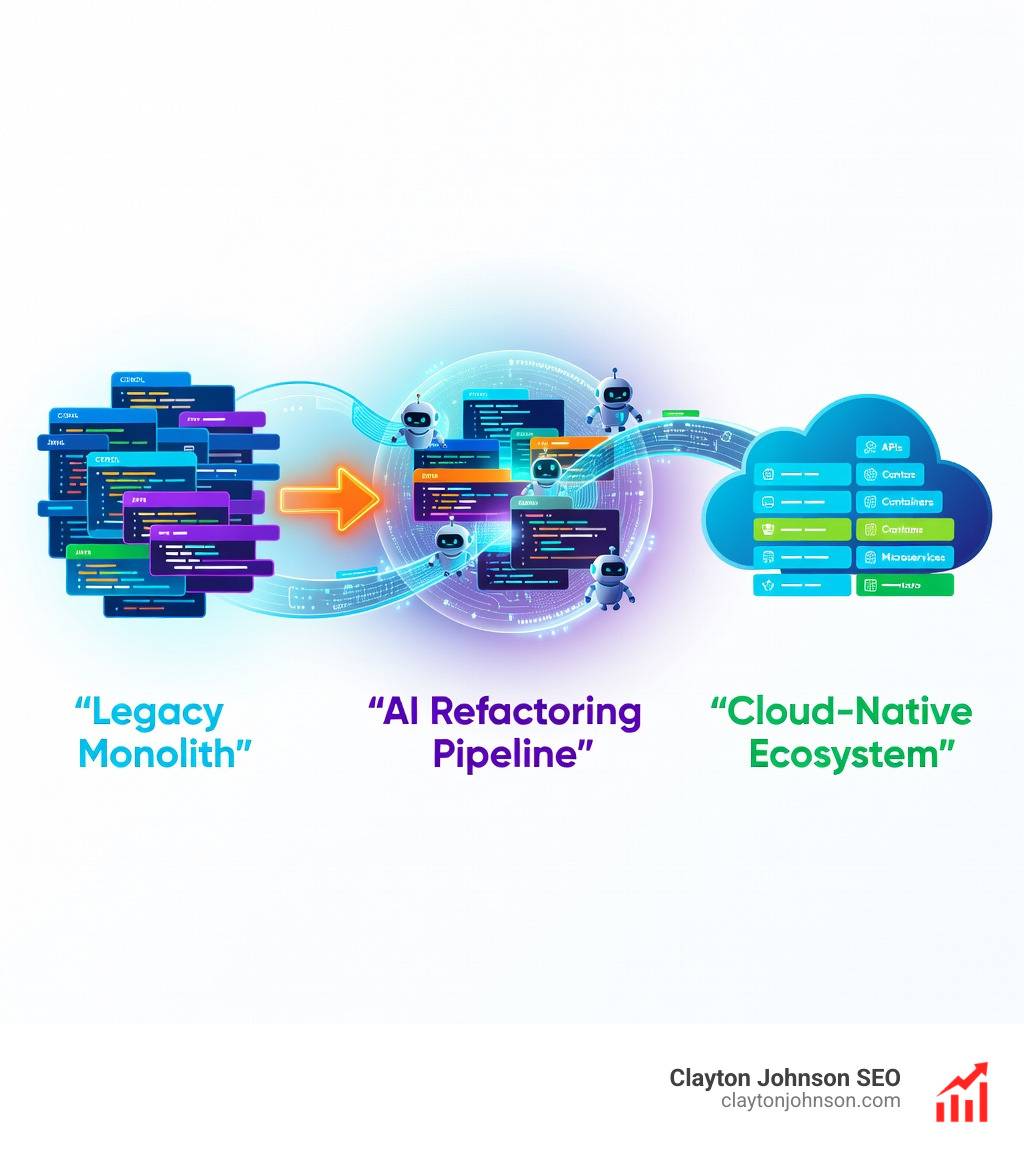
- Business Process Reengineering (BPR): Sometimes, the engine is too broken to fix. BPR is the radical redesign of processes from scratch. A classic example is Ford, which Reduced workforce requirements by 75% in its accounts payable department by obliterating traditional invoices in favor of a direct-input system.
Essential Problem-Solving and Mapping Tools
To implement these methodologies, you need a toolkit. Here are the “heavy hitters” we use to diagnose and fix processes:
- Value Stream Mapping (VSM): A visual tool to see the flow of materials and information. It helps you identify where value is added and where it’s just sitting in a queue. Learn more about value stream mapping to see the whole picture.
- 5 Whys: A simple but profound technique. When a problem occurs, ask “Why?” five times to get past the symptoms and find the root cause.
- Fishbone Diagrams: Also known as Ishikawa diagrams, these help teams brainstorm all potential causes of a problem by categorizing them (e.g., People, Methods, Machines, Materials).
- Pareto Analysis: The 80/20 rule. It helps you identify the 20% of causes that are responsible for 80% of your problems.
- SIPOC Diagrams: This maps the Suppliers, Inputs, Process, Outputs, and Customers. It’s excellent for defining the boundaries of a project.
- Statistical Process Control (SPC): Using math to monitor and control a process. It helps you distinguish between “normal” variation and a process that is actually broken.
- Gemba Walks: “Gemba” means the real place. It involves leaders going to where the work actually happens to observe processes rather than relying solely on reports.
A Framework for Implementing Process Changes

Implementing Process Improvement & Scoring requires a structured approach. You can’t just walk into a room and start changing things; you’ll face immediate resistance and likely break something that was actually working.
We recommend a phased approach:
- Problem Identification: Use data, not just “feelings,” to identify what’s wrong.
- Current-State Mapping: You must understand the “as-is” process before you can design the “to-be” process. Don’t map how it’s supposed to work—map how it actually works.
- Solution Design: This is the creative phase. Use frameworks like the-diy-guide-to-not-failing-your-design-sprint to rapidly prototype and ideate solutions.
- Pilot Testing: Never roll out a major change to the whole company at once. Test it with one team or one product line first.
- Full-Scale Rollout: Once the pilot is successful, scale it up.
- Standard Operating Procedures (SOPs): Documentation is the “ratchet” that prevents the process from sliding back to the old way.
Project Management and Stakeholder Engagement
Success in process improvement is 20% technical and 80% people. You need robust stakeholder management to ensure everyone from the CEO to the frontline worker is on board.
- Team Ground Rules: Establish how the team will communicate and make decisions.
- Testing Procedures: Define what “success” looks like before you start the pilot. This prevents “moving the goalposts” later.
- Feedback Loops: Create channels for employees to tell you what isn’t working. They are the ones living the process every day.
- Conversion and Optimization: In marketing and sales, we often use services/conversion-optimization to ensure that process changes actually result in more revenue, not just “cleaner” data.
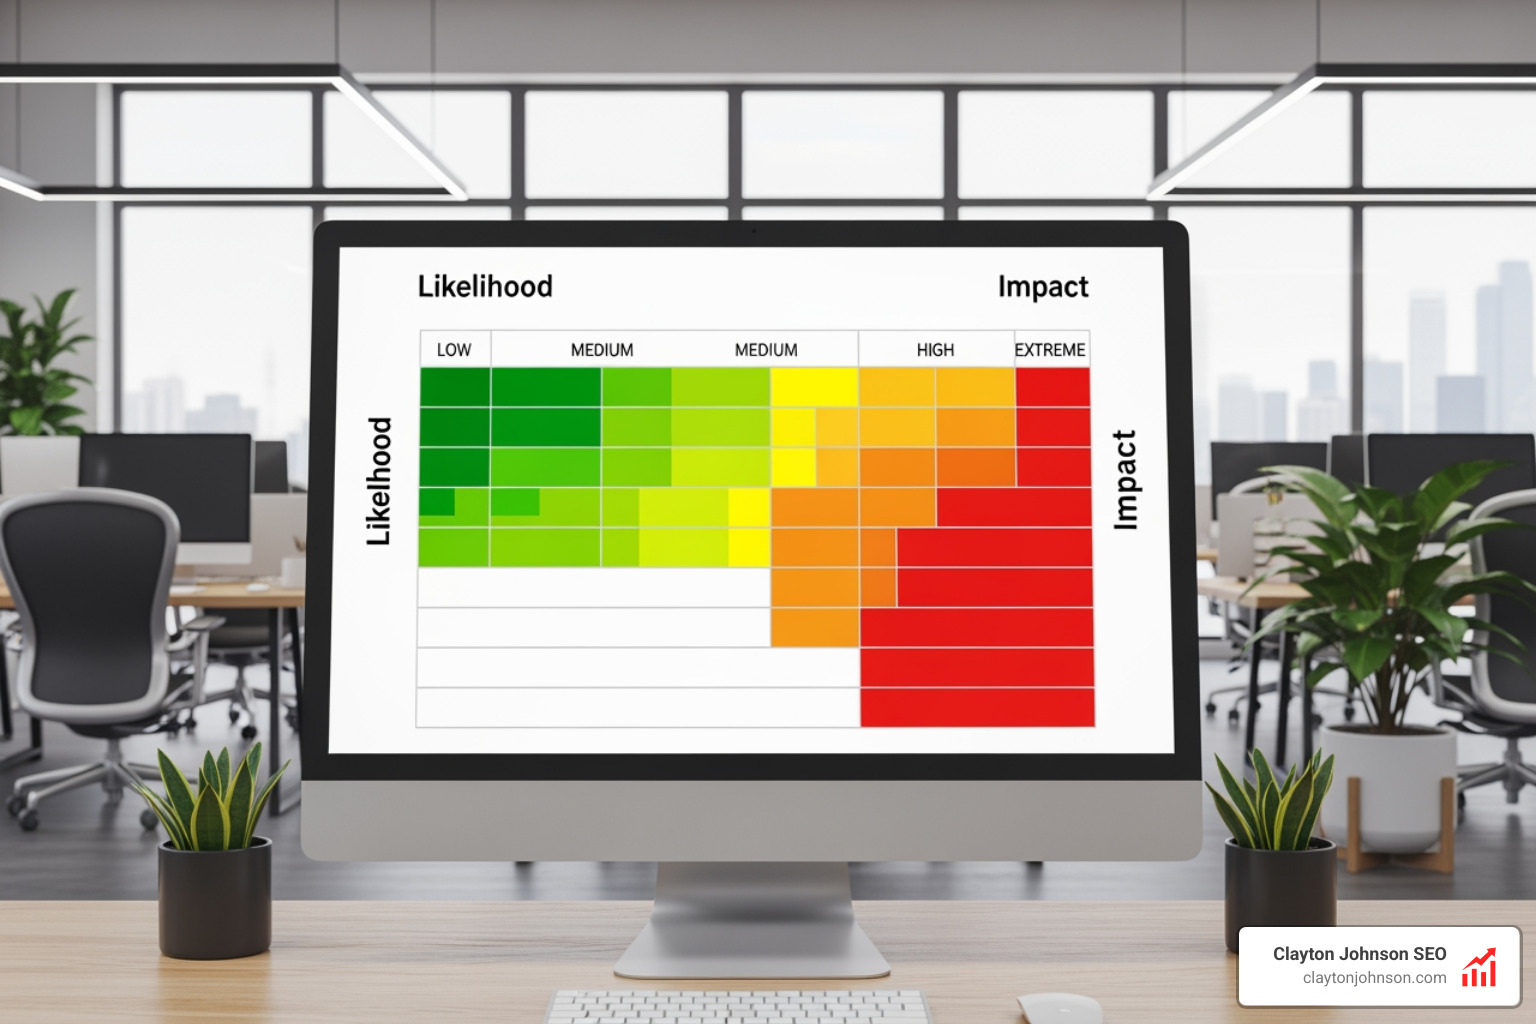
Advanced Scoring: Measuring Impact with Data and KPIs

This is where the “Scoring” part of Process Improvement & Scoring truly shines. Without a score, you’re just practicing; you aren’t playing the game.
Advanced organizations use sophisticated scoring guides to evaluate performance. For example, in healthcare, the Traditional MIPS Scoring Guide uses a decile-based system to compare performance against historical benchmarks. This allows for a fair “score” even when processes vary across different regions or specialties.
To build a robust scoring system, you need to look at three types of measures:
| Measure Type | What it Measures | Example |
|---|---|---|
| Outcome Measures | The final result of the process. | Total revenue, Customer satisfaction score. |
| Process Measures | Whether the steps are being followed. | % of invoices processed within 24 hours. |
| Balancing Measures | Unintended consequences. | Did reducing call time lower customer satisfaction? |
When setting up your services/analytics-data systems, ensure you meet “data completeness” standards. A score based on 10% of your data is worse than no score at all—it’s a lie.
Key Metrics for Process Improvement & Scoring
To truly understand your progress, track these core metrics:
- Cycle Time: How long does it take from the start of a process to the end?
- Error Rates: How often does the process fail or require rework?
- Cost Savings: Both “hard savings” (less money spent) and “soft savings” (time recovered).
- ROI Tracking: Does the improvement return more value than it cost to implement?
- Data Completeness: Ensuring you have a representative sample (often a case minimum of 20-25 data points) before making major decisions.
Frequently Asked Questions about Process Improvement & Scoring
How long does it take to see results from process improvement?
While a full cultural shift takes time, focused improvements typically show results within 30 to 90 days. Quick wins—like reorganizing a workspace or automating a single repetitive task—can often show impact within a single week.
What is the difference between process improvement and reengineering?
Process improvement focuses on making an existing process better through incremental changes. Business Process Reengineering (BPR) involves throwing the old process away and starting with a blank sheet of paper to achieve radical, 10x improvements.
How do you overcome employee resistance to new processes?
Resistance usually stems from a lack of involvement or fear of the unknown. Overcome this by involving frontline employees in the design phase, communicating the “why” clearly, and showing how the new process makes their jobs easier, not just the company more profitable.
Conclusion
Mastering Process Improvement & Scoring is the difference between a business that survives and one that dominates. By combining rigorous methodologies like Lean and Six Sigma with advanced data scoring, you turn your operations into a strategic asset.
At Clayton Johnson SEO, we specialize in building the systems that fuel growth. Whether you need to align your operations, optimize your data, or build a content engine that actually converts, we have the frameworks to make it happen.
Ready to stop losing 30% of your revenue to inefficiency? Work with me and let’s build your competitive moat together.