Why Marketing Teams Are Drowning in Backlogs (and How ICE Can Help)
ICE prioritization marketing backlogs is a scoring framework that helps marketing teams rank tasks by multiplying three factors: Impact (how much it moves the needle), Confidence (how certain you are it will work), and Ease (how simple it is to execute). The result is an objective priority score that cuts through endless debates about what to do next.
Quick answer: How to use ICE prioritization for marketing backlogs
- List all marketing tasks (campaigns, content, experiments, optimizations)
- Score each task 1-10 on Impact, Confidence, and Ease
- Calculate ICE score by multiplying Impact × Confidence × Ease
- Rank by score and work on the highest-scoring items first
- Re-score monthly as new data emerges
Here’s the reality: marketing backlogs grow faster than teams can execute. Every stakeholder wants their campaign prioritized. Every channel needs attention. Every experiment sounds promising.
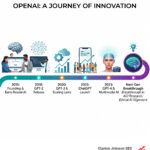
The ICE framework was created by Sean Ellis—the founder of GrowthHackers and the person who coined “growth hacking”—to solve exactly this problem. He needed a way to prioritize growth experiments at LogMeIn and Dropbox fast, without getting stuck in analysis paralysis.
Unlike heavyweight frameworks that demand precise user counts or multi-week estimation sessions, ICE lets you score an entire backlog in 90 minutes. It’s built for speed and “good enough” decisions when you’re moving fast with limited data.
The method works because it forces you to answer three honest questions about every task:
- Impact: Will this actually move our North Star metric?
- Confidence: Do we have proof this works, or are we guessing?
- Ease: Can we ship this quickly, or will it drag for months?
Multiply those three scores together, and suddenly the priorities become clear. The high-impact, high-confidence, easy wins bubble to the top. The risky moonshots with low confidence sink to the bottom—unless you’re deliberately allocating budget for learning experiments.
I’m Clayton Johnson, and I’ve used ICE prioritization marketing backlogs to help teams cut through competing priorities and ship what matters. I build structured systems that turn chaotic marketing efforts into measurable growth engines—and ICE is one of the simplest, most effective tools in that toolkit.
, Confidence (1-10: how certain you are it will work based on data), and Ease (1-10: how simple it is to implement); Step 3 - Calculate ICE score by multiplying Impact × Confidence × Ease; Step 4 - Rank tasks by ICE score from highest to lowest; Step 5 - Work on top-scoring items first and re-score monthly as new data emerges - ice prioritization marketing backlogs infographic pillar-5-steps")
Key terms for ice prioritization marketing backlogs:
The ICE Framework: Definition and Calculation

The ICE framework is more than just a math equation; it is a mindset shift for growth teams. When marketing backlogs become “dramatic,” as some teams describe them—longer than a soap opera script—we need a surgical tool to find the value.
The framework was popularized by Sean Ellis), who needed a way to manage growth experiments at high-growth companies like LogMeIn and Dropbox. His goal was to move away from “HiPPO” decision-making (Highest Paid Person’s Opinion) and toward a system where data and logic dictated the roadmap.
ICE is built on three pillars that align perfectly with our digital-marketing-pillars:
- Impact: How much will this idea contribute to our goal? If we are focusing on lead generation, a task that optimizes the checkout page has a higher impact than changing the footer color.
- Confidence: How sure are we that this will work? This is the “reality check” component. It prevents us from chasing shiny objects that have no supporting data.
- Ease: how simple is this to launch? This includes design, development, and testing. In marketing, a “10” for ease might be a simple copy change, while a “1” might be building a custom interactive tool from scratch.
How to Calculate an ICE Score
There are two primary ways to calculate your final score, and choosing the right one depends on how much “differentiation” you need in your list.
1. The Multiplication Method (The Standard)
Impact x Confidence x Ease = ICE Score
If you score each factor on a scale of 1-10, your total score will range from 1 to 1,000. This is the preferred method for many because it amplifies the differences between tasks. For example, an onboarding optimization might score 504, while a complex AI feature scores only 60. This makes it very easy to see which task should be tackled first.
2. The Average Method
(Impact + Confidence + Ease) / 3 = ICE Score
Some teams prefer this for stability. It keeps the final score on a 1-10 scale, which can be more intuitive for internal reporting. However, it can lead to “clusters” where many tasks have very similar scores (e.g., a 7.1 vs. a 7.2), making it harder to distinguish the winner.
The Scoring Scale: 1-10 vs. Fibonacci
While the 1-10 scale is common, many advanced teams use the Fibonacci sequence (1, 2, 3, 5, 8, 13). Why? Because it’s often impossible to decide if a task is a “6” or a “7” in impact. The Fibonacci sequence forces you to make a choice between “moderate” (5) and “high” (8), reducing the time spent debating minor points.
For more on how to structure these types of evaluations, check out our guide on process-improvement-scoring-101.
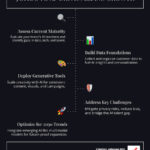
Step-by-Step Guide to ICE Prioritization Marketing Backlogs

Applying ICE to your ice prioritization marketing backlogs isn’t a solo sport. It works best as a collaborative workshop. Here is the process we recommend to our clients in Minneapolis and beyond:
- Backlog Assembly: Gather every idea, bug fix, and campaign concept into one place. Don’t filter yet.
- Independent Scoring: Have team members score Impact, Confidence, and Ease individually. This prevents “groupthink” where everyone just agrees with the loudest person in the room.
- Team Reconciliation: Bring the scores together. If one person gave an idea a “10” for Ease and another gave it a “2,” that’s a red flag. Discuss the discrepancy. Usually, the person with the “2” knows about a technical hurdle the other didn’t consider.
- The 90-Minute Rule: A major benefit is speed. Research shows that ICE helps teams score an entire backlog in 90 minutes, not 90 days.
- Finalize the Roadmap: Sort by the highest score and draw a “capacity line” based on your resources.
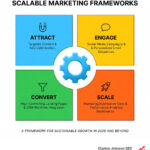
To get started, you can use our ICE scoring template for marketing prioritization to organize your thoughts. This fits perfectly into a broader strategy for scalable marketing frameworks.
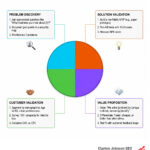
Defining Impact for ICE Prioritization Marketing Backlogs
In a marketing context, “Impact” can feel subjective. To fix this, we anchor it to your North Star Metric.
We often look at Impact through the lens of Pirate Metrics (AARRR):
- Acquisition: Will this bring in new traffic?
- Activation: Will this get users to take their first action?
- Revenue: Will this directly lead to a sale?
- Retention: Will this keep customers coming back?
- Referral: Will this encourage users to invite others?
Generally, tasks affecting Revenue or Retention score higher (8-10) than pure Acquisition tasks (1-5), because a 1% lift in retention often has a much larger bottom-line effect than a 1% lift in top-of-funnel traffic.
Scoring Confidence and Ease in ICE Prioritization Marketing Backlogs
Confidence is the antidote to the “good idea” trap. To score this accurately, look at your data.
- Score 10: We’ve done this before and it worked.
- Score 5: We have case studies or external benchmarks suggesting it works.
- Score 1: It’s a total hunch with no supporting evidence.
Ease must account for the entire implementation, not just the marketing copy. Does it require a developer? Does it need a new legal review? Does it involve technical debt? A task that takes one day to ship is a 10. A task that takes a full quarter is a 1.
By using these clear anchors, you can stop guessing and start analyzing your marketing efforts.
ICE vs. RICE, PIE, and HiPPO

| Framework | Components | Best For | Pros | Cons |
|---|---|---|---|---|
| ICE | Impact, Confidence, Ease | Growth Teams, Startups | Extremely fast, simple | Highly subjective |
| RICE | Reach, Impact, Confidence, Effort | Mature Products | More objective, accounts for volume | Takes much longer to calculate |
| PIE | Potential, Importance, Ease | CRO/Testing | Great for landing pages | Overlaps between P and I |
| HiPPO | Boss’s Opinion | Traditional Corps | No meetings required | Often wrong, ignores data |
The biggest difference between ICE and RICE is the Reach dimension. RICE asks, “How many people will see this?” While this is great for mature products with millions of users, it can be overkill for a marketing team trying to decide between three different email subject lines.
ICE is the prioritization technique of choice when speed is more important than perfect precision. As your data matures, you might transition to RICE, but for most marketing backlogs, ICE provides the necessary alignment without the administrative burden.
Benefits and Limitations of the ICE Model
The Benefits:
- Speed: You can prioritize 50 objectives in 30 minutes.
- Alignment: It turns “I think we should do this” into “This scores a 400, while that scores a 150.”
- Transparency: Everyone sees why their pet project didn’t make the cut.
The Limitations:
- Subjectivity: One person’s “8” is another person’s “5.”
- Low-Hanging Fruit Bias: Because “Ease” is a multiplier, the model naturally favors small, easy tasks over massive, strategic bets. You have to be careful not to ignore “Big Bets” just because they have a low Ease score.
- Score Inflation: Teams tend to score everything as a 9 or 10.
The Fix for Score Inflation:
To keep your ice prioritization marketing backlogs honest, enforce a distribution constraint. For example:
- No more than 20% of tasks can score a 9 or 10 on any dimension.
- At least 20% must score between 1 and 4.
This forces the team to make brutal choices about what is truly impactful.
Frequently Asked Questions about ICE Prioritization
How often should marketing teams re-score their backlogs?
We recommend a full re-scoring once a month or at the start of every new sprint cycle. Marketing moves fast. A task that was “Easy” last month might become “Hard” this month if your lead developer goes on vacation. Likewise, a “Low Confidence” task might become “High Confidence” once you see the results of a small pilot test.
What are the best tools for implementing ICE scoring?
You don’t need fancy software. A simple spreadsheet with five columns (Task, I, C, E, Total) is often the most effective tool. However, if your team is already using Jira or Airtable, there are plugins and templates specifically designed to automate ICE calculations and visualize your priority matrix.
How can teams reduce subjectivity in ICE scores?
- Anchoring: Define exactly what a “5” in Ease means (e.g., “Takes one week of work”).
- Group Estimation: Use the “Planning Poker” method where everyone reveals their score at the same time.
- Data Benchmarks: Require a link to a data point or past campaign result for any Confidence score above a 5.
Conclusion
At Clayton Johnson SEO, we believe that the best strategy in the world is useless if you can’t decide what to execute first. ICE prioritization marketing backlogs provide the structure needed to turn a mountain of ideas into a streamlined path to growth.
By focusing on Impact, Confidence, and Ease, you move away from gut feelings and toward measurable results. Whether you are a founder in Minneapolis or a marketing leader at a scaling SaaS company, this framework will help you ship faster and with more certainty.
If you’re ready to stop guessing and start growing, learn more about our SEO services and how we can help you build a high-performance marketing engine.