Why Developers Are Turning to AI Code Debuggers
An ai code debugger uses artificial intelligence to automatically identify, diagnose, and resolve bugs in your code—saving you hours of manual stepping through breakpoints and print statements. Here’s what you need to know:
Top AI Code Debuggers in 2026:
- OpenCode – Open-source agent with 100k+ GitHub stars, used by 2.5M developers monthly
- Zentara Code – 99.9% AI-written debugging engine, cuts mean-time-to-repair by 60%
- Codex – OpenAI’s coding agent with multi-agent workflows and cloud environments
- ChatDBG – Interactive debugging with natural language queries
- Lightrun Autonomous Debugger – Runtime debugging directly in your IDE
Key Capabilities:
- Automated bug detection and root cause analysis
- Context-aware fix suggestions based on runtime state
- Interactive debugging with breakpoints and variable inspection
- Multi-language support via Debug Adapter Protocol (DAP)
- Performance optimization recommendations
Debugging consumes 20% to 50% of developer time—that’s roughly 2.5 to 5 months per year on a typical project. Traditional debugging methods require manual code stepping, inserting print statements, and hunting for edge cases in complex codebases. AI code debuggers change this by leveraging machine learning, natural language processing, and predictive analytics to proactively scan your code, generate hypotheses about failures, and suggest targeted fixes.
The shift is significant. GitHub’s CEO predicted that 80% of code will be written by AI tools like Copilot, and some Y Combinator startups report 95% of their codebase generated by large language models. But writing code fast creates a new bottleneck: verifying and debugging that code. That’s where AI debuggers become essential—they trace failures, inspect runtime state, and iteratively rewrite failing code until it succeeds.
I’m Clayton Johnson, an SEO and growth strategist who builds AI-assisted marketing workflows and technical systems. I’ve evaluated dozens of ai code debugger tools to help development teams reduce debugging overhead and ship more reliable software faster.
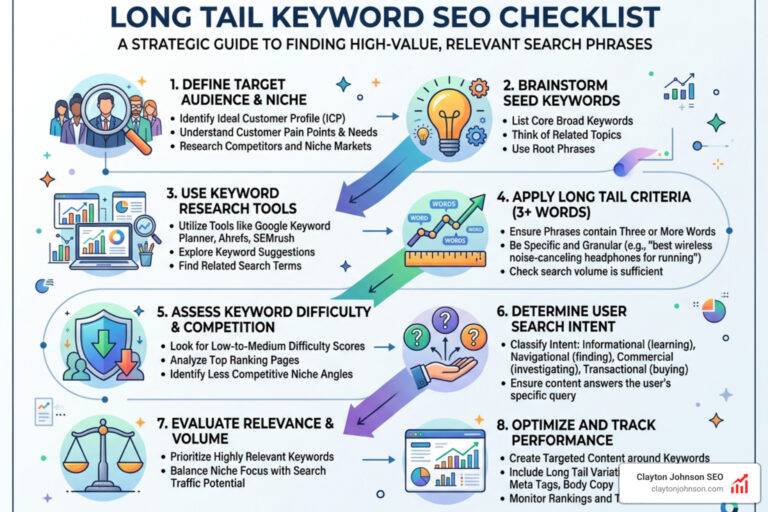
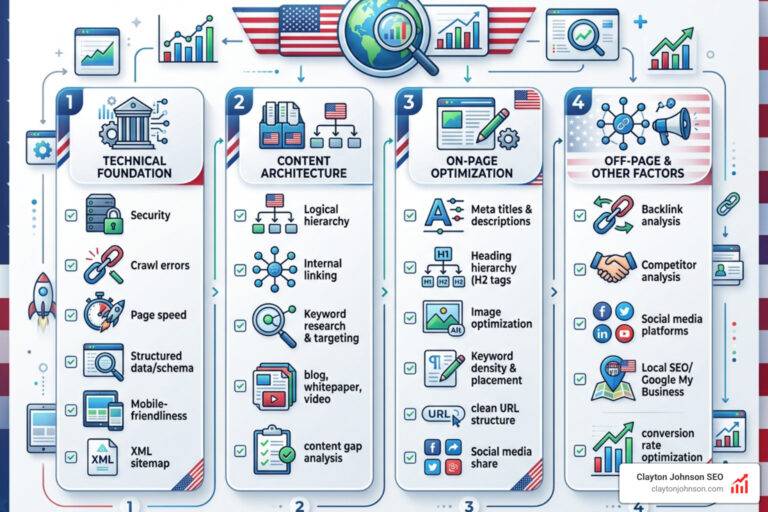
, traditional methods rely on manual stepping and print statements, AI debuggers offer automated detection with 60% MTTR reduction, key technologies include machine learning pattern recognition and runtime state inspection, and benefits include faster issue resolution, context-aware suggestions, and interactive debugging environments - ai code debugger infographic")
What is an AI Code Debugger?
At its core, an ai code debugger is a software solution that integrates artificial intelligence to automate the identification and resolution of software defects. Unlike a standard compiler that just tells you where the syntax error is, an AI debugger understands the intent of your code. It leverages machine learning models trained on millions of lines of open-source repositories to recognize patterns associated with common vulnerabilities, logic errors, and performance bottlenecks.
These tools use Natural Language Processing (NLP) to allow us to talk to our code. Instead of manually inspecting a stack trace, we can ask, “Why is this variable returning null in production?” The AI performs a root cause analysis by scanning the code, analyzing error patterns, and predicting where the logic likely diverged from the intended outcome.
Research into quality improvement through testing shows that catching bugs early is the single most effective way to maintain project velocity. AI debuggers take this a step further by providing predictive analytics—guessing where a bug might appear before the code is even executed.

How AI Differs from Traditional Debugging
Traditional debugging is a manual, linear process. We set breakpoints, step through the code line-by-line, and use print statements to “see” inside the application’s memory. It’s effective but incredibly slow.
An ai code debugger shifts this from manual labor to heuristic analysis. Instead of us hunting for the needle in the haystack, the AI uses pattern recognition to point directly to the anomaly. While a traditional debugger shows you the state of the program, an AI debugger provides contextual awareness. It knows that a specific pattern in a Python script often leads to a race condition and warns you before you even hit “run.”
The Role of Large Language Models in Error Resolution
Large Language Models (LLMs) have transformed debugging from a static analysis task into an interactive dialogue. Modern LLM-based agents, like those used in the OpenAI Code Interpreter, operate in sandboxed environments. This allows them to execute code, observe the failure, and perform iterative rewriting.
When the code fails, the model doesn’t just give up; it reads the error message, adjusts the logic, and runs it again until it succeeds. This “trial and error” loop happens in seconds, replicating what a human developer might do over the course of an hour. If you’re looking to scale your technical presence in competitive markets, understanding these SEO services in Minneapolis can help you apply similar AI-driven efficiency to your growth strategy.
Key Features of a Robust AI Code Debugger
Choosing the right ai code debugger depends on its ability to integrate with your existing workflow. A robust tool should offer more than just chat-based advice; it needs to live where you code.

Automated Detection and Runtime Control
The most advanced debuggers today, such as Zentara Code, use the Debug Adapter Protocol (DAP). This makes them language-agnostic, meaning they can debug Python, JavaScript, Go, or C++ within the same interface. Key features include:
- Breakpoint Management: AI can suggest where to place conditional breakpoints based on where it suspects a logic leak.
- State Inspection: The AI automatically highlights variable values that look “suspicious” (e.g., a quantity that suddenly becomes
NaN). - Pytest and Test Runner Integration: Tools like Zentara can intercept test failures in real-time, allowing for immediate interactive debugging rather than waiting for the full test suite to finish.
Context-Aware Suggestions in an AI Code Debugger
Context is everything. An AI debugger doesn’t just look at a single line; it looks at the entire repository. This allows it to generate hypotheses about why a function is failing. For example, it might notice that a missing null check in a data-fetching function is causing a crash three files away.
These tools also provide performance optimization. In one documented case, AI-powered suggestions helped a user reduce their API response time by 40% by identifying redundant database queries and suggesting more efficient iteration patterns.
Interactive Debugging Environments
The frontier of this technology is the “interactive” environment. Microsoft’s research on the Debug-gym environment is a prime example. Debug-gym is a playground for AI agents to learn how to use traditional tools like pdb (the Python debugger).
Instead of just guessing a fix, the AI agent in this environment exhibits “information-seeking behavior.” It will actively set a breakpoint, check a variable, and steer the codebase to gather evidence before proposing a solution. This collaborative dialogue between the developer and the AI agent ensures that the fix isn’t just a “band-aid” but a genuine resolution of the root cause.
Top AI-Powered Debugging Tools for 2026
The market for AI debugging is moving fast. Here is a look at the heavy hitters currently dominating the space.
| Feature | OpenCode | Zentara Code | OpenAI Codex |
|---|---|---|---|
| Primary Strength | Open-source & Privacy | Autonomous Runtime Debugging | Enterprise Workflows |
| GitHub Stars | 100,000+ | N/A (Fork of Roo-Code) | N/A |
| Key Metric | 2.5M Monthly Users | 60% MTTR Reduction | 2x Rate Limits for Teams |
| Best For | General Purpose Coding | Deep Runtime Fixing | Full Lifecycle Management |
Specialized Solutions for Teams and Individuals
- Graphite Agent: Focuses heavily on the code review stage, catching bugs before they are even merged into the main branch.
- ChatDBG: An open-source assistant that lets you have a literal conversation with your debugger, asking complex questions about program states.
- Workik: Provides automated debugging pipelines and precision error tracking, making it a favorite for teams running complex web apps.
- Lightrun Autonomous Debugger: Specializes in production debugging. It allows you to add dynamic logs and snapshots to live applications without restarting them.
- FixCode & ZZZ Code AI: These are excellent for quick, one-off fixes and online code analysis, especially for developers who are still learning the ropes.
Enterprise-Grade Agentic Workflows
For large organizations, OpenAI’s Codex remains a powerhouse. It is designed for multi-agent workflows where one AI might be writing code while another is running background automations to monitor CI/CD pipelines. Codex can handle complex refactors and migrations across entire worktrees, effectively completing “weeks of work in days.”
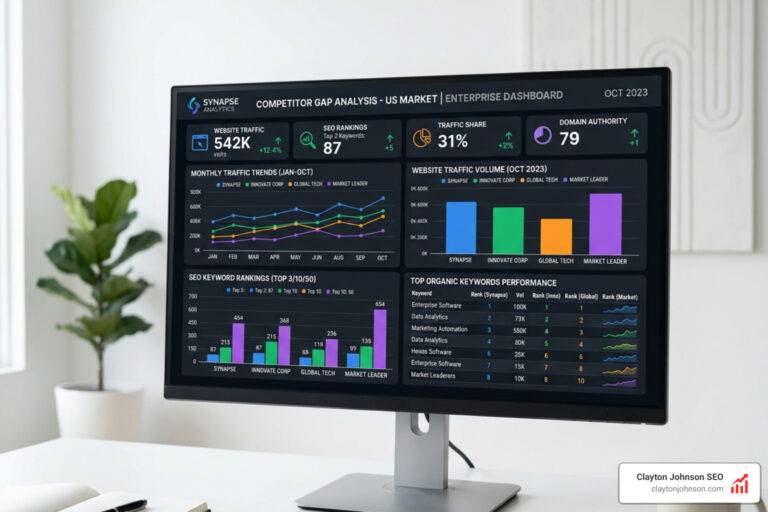
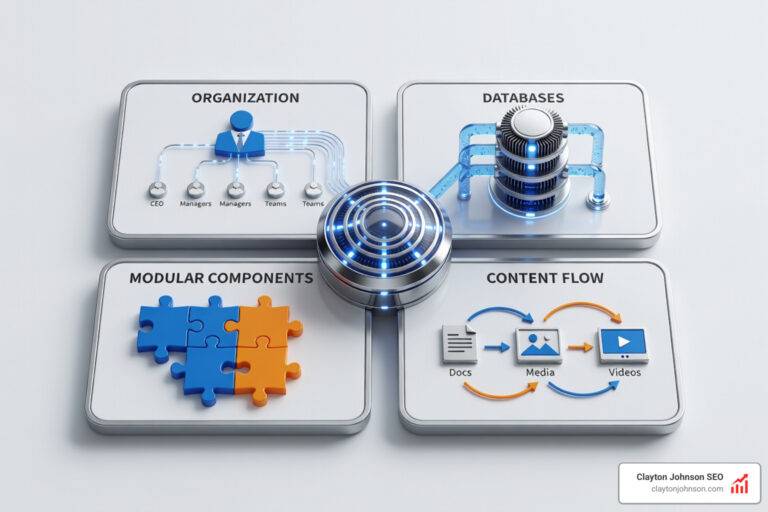
, 40% improvement in API response times through AI optimization, and a 95% adoption rate for LLM-generated code in top startups - ai code debugger infographic")
Integrating AI into the Software Development Lifecycle
Integrating an ai code debugger isn’t just about fixing errors; it’s about changing how we build. By moving toward proactive scanning, we can stop bugs before they reach production.
Handling Complex Scenarios and Large Codebases
Large codebases are notorious for “intermittent” bugs—the ones that only happen on every third Tuesday when the moon is full. AI tools like Probe AI use semantic search to index entire codebases. When a bug occurs, you can search for “error handling in the auth module” and get a JSON-structured output of every relevant line of code, ranked by relevance.
This codebase indexing allows the AI to understand interconnected systems. It knows that changing a column name in the database will break a specific frontend component, preventing the “ripple effect” of bugs that often plagues large teams.
Collaborative Debugging: AI vs. Human Developers
The big question: Will AI replace us? The short answer is no. While GitHub’s CEO predicts that 80% of code will be written by AI, the human role is shifting toward direction and verification.
AI is brilliant at “PhD-level drafting,” but it can still struggle with context-specific issues or high-level logic that requires human judgment. We use AI as a collaborative tool—it handles the tedious task of finding the typo or the missing null check, while we focus on the architecture and the user experience. You can read more about this shift in the latest research on teaching AI to debug.
Frequently Asked Questions about AI Code Debuggers
Can AI completely replace human developers in the debugging process?
No. AI is a powerful collaborative tool, but it lacks the full context of business requirements and “human” logic. It excels at identifying patterns and common errors, but a human developer is still needed to verify that the suggested fix doesn’t have unintended side effects on the broader system.
How do AI debugging tools handle intermittent or “Heisenbugs”?
AI debuggers handle these by analyzing trajectory data—the sequence of events leading up to a crash. By inspecting the runtime state and using information-seeking agents, the AI can often reproduce the specific conditions that cause an intermittent bug, making it much easier to squash than traditional “guess-and-check” methods.
What are the primary benefits of AI-powered runtime debugging?
The biggest benefit is the reduction in Mean-Time-To-Repair (MTTR), which can be cut by up to 60%. It also significantly decreases developer frustration and accelerates learning for junior developers by explaining exactly why a piece of code failed and providing the fix instantly.
Conclusion
The era of manual debugging is drawing to a close. As we’ve seen, an ai code debugger is no longer a luxury—it’s a prerequisite for staying competitive in a world where code is generated at lightning speed. Whether you are using OpenCode for its privacy features or Zentara Code for its deep runtime integration, these tools allow us to spend less time fixing the past and more time building the future.
At Clayton Johnson, we specialize in building AI-assisted workflows that help businesses find what’s broken, fix it fast, and grow with confidence. From SEO strategy to scalable content systems, our goal is simple: diagnose the real problems and execute solutions you can measure. If you’re ready to improve performance and momentum, explore our SEO and Content Services and see what a smarter growth system looks like.


")