Competitive Positioning Map Demystified
Why Every Business Needs a Competitive Positioning Map
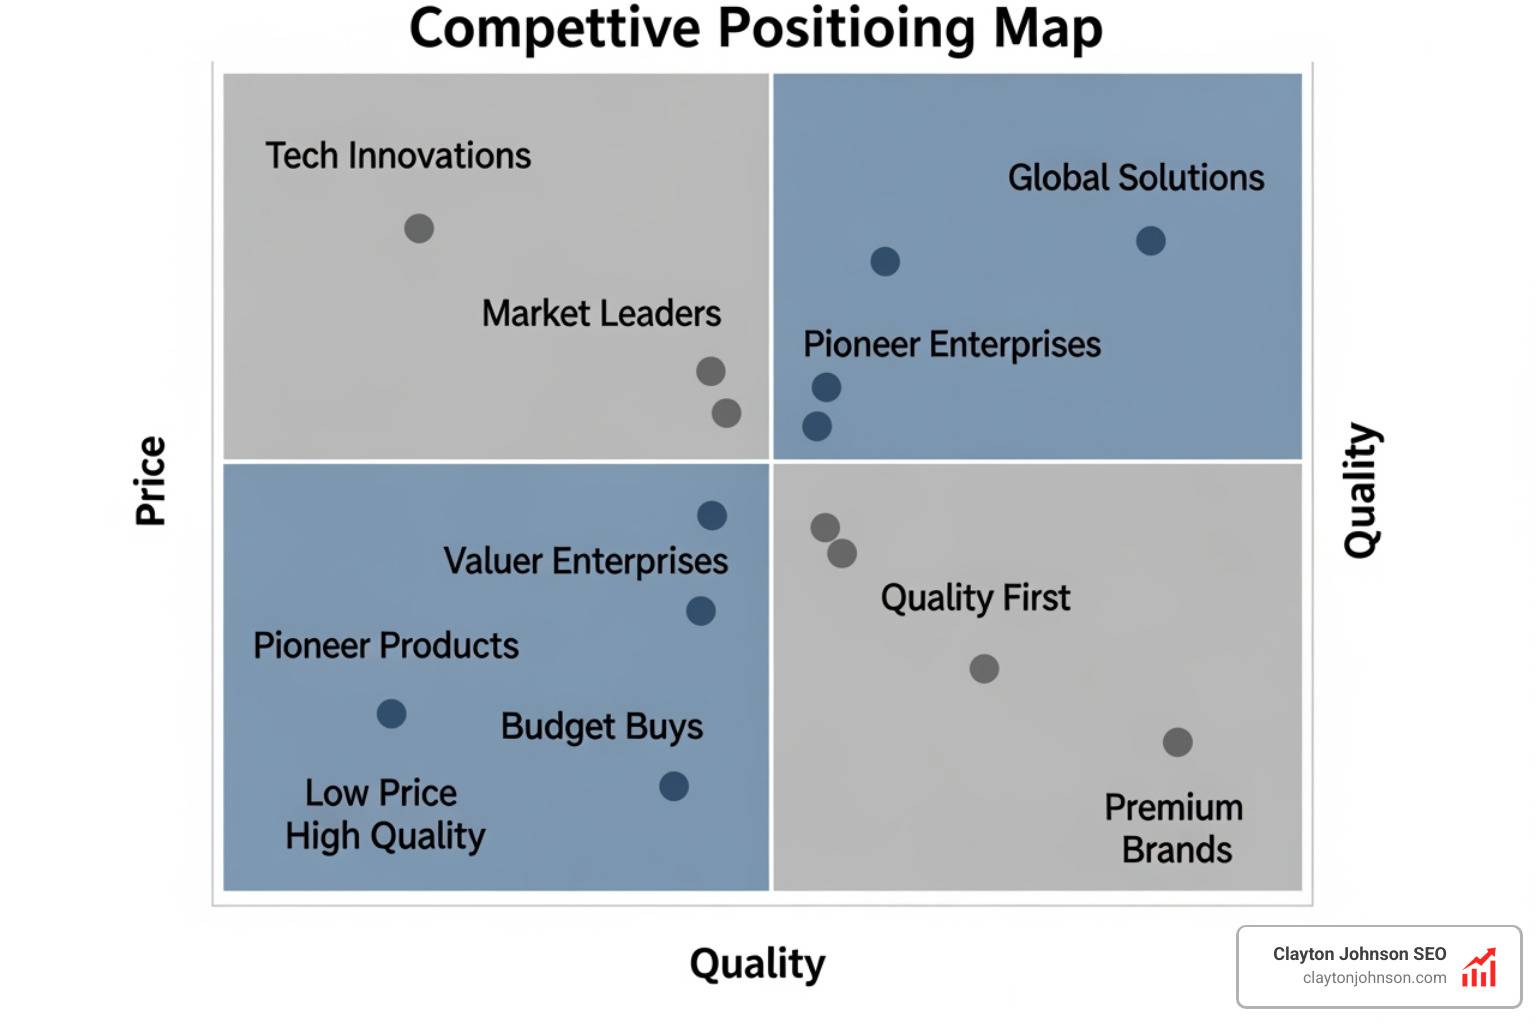
A competitive positioning map is a visual tool that plots your brand and your competitors on two axes — most commonly price and perceived quality or benefit — so you can instantly see where you stand in the market.
Here’s a quick breakdown:
| Element | What It Means |
|---|---|
| Axes | Two attributes that matter most to your customers (e.g., price vs. quality) |
| Plotted brands | Your company and key competitors placed based on data |
| Clusters | Groups of competitors fighting for the same space |
| White space | Open areas with little or no competition — your opportunity |
Most businesses think they know where they stand. But consider this: 80% of CEOs believe they deliver a superior customer experience, yet only 8% of their customers agree. That gap is exactly what a positioning map exposes.
The map doesn’t care about your internal opinions. It reflects what the market actually sees.
And in fast-moving markets, that clarity is the difference between leading and being left behind. Think of Motorola’s Razr team in the summer of 2007 — just eight weeks after Apple launched the iPhone, they were scrambling to figure out whether their flagship product had been made irrelevant overnight. A sharp, up-to-date positioning map could have surfaced that threat before the launch shook the market.
Whether you’re entering a new market, refining your pricing, or planning your next product launch, a positioning map gives you a grounded, strategic view of the landscape.

Defining the Competitive Positioning Map
At its heart, a competitive positioning map (often used interchangeably with a perceptual map) is a diagram that simplifies market complexity. It takes a messy, crowded marketplace and turns it into a clear, visual story. While a perceptual map focuses strictly on how consumers feel about a brand, a positioning map often incorporates more objective data points like price or specific technical capabilities.
The disconnect between internal perception and market reality is a silent killer for many brands. As noted in research by Bain & Company, 80 percent of CEOs believe they provide a superior experience, but only 8% of customers agree. This “delivery gap” happens because companies focus on what they want to be, rather than how they are actually perceived.
By visualizing your competitive edge with a strategy canvas, we can see where our brand lives in the minds of our target audience. This process helps us define our value proposition—the unique promise of value that makes a customer choose us over someone else.
Understanding these market dynamics is essential for any marketer. If you ever feel lost in the jargon, checking a Marketing Terms Cheat Sheet can help clarify the difference between consumer benefits (what the user gets) and product features (what the product does). A successful map focuses on the benefits that drive the purchase decision.
4 Steps to Build Your Competitive Positioning Map
Creating a map isn’t just about drawing two lines and guessing where people land. It requires a disciplined approach to data. We believe in competitive analysis 101: keeping your friends close and your competitors closer, which means looking beyond just the obvious rivals.

1. Identify Your Category and Competitors
Start by defining the “arena” you are playing in. This includes direct competitors (who sell what you sell), indirect competitors (who solve the same problem differently), and the “status quo” (customers doing nothing or using a manual workaround like Excel).
| Competitor Type | Example (Project Management Software) |
|---|---|
| Direct | Asana, Monday.com |
| Indirect | Trello (Kanban focused), Notion (Doc focused) |
| Status Quo | Excel spreadsheets, “Just using email” |
2. Choose Your Attributes (The Axes)
Select two dimensions that actually drive buying behavior. If you choose “Color” and “Logo Shape,” you probably won’t get much strategic value. Instead, focus on things like “Ease of Use” vs. “Enterprise Power” or “Price” vs. “Customization.”
3. Gather and Normalize Data
To avoid the CEO perception trap, use unbiased data. This includes customer surveys, G2/Capterra reviews, and pricing sheets. You must think about competitive pressure objectively. If a competitor is cheaper but has a terrible user interface, the data should reflect that, regardless of how much your sales team dislikes them.
4. Plot and Interpret
Place your brand and your rivals on the map. Look for clusters (crowded areas) and gaps (white space). This visual representation makes it easy to communicate strategy to stakeholders without needing a 50-page slide deck.
Selecting Relevant Axes for a Competitive Positioning Map
The “Price vs. Benefit” axis is a classic for a reason—it’s how most humans make decisions. However, to truly stop guessing and start positioning with competitive intelligence, we need to dig deeper into emotional drivers.
For a luxury perfume brand, the axes might be “Traditional vs. Modern” and “Price.” For a B2B SaaS tool, it might be “Implementation Time” vs. “Feature Depth.” We use sliding scale metrics with opposite extremes (e.g., “Economy” at one end and “Premium” at the other) to ensure the map remains readable. The goal is to find attributes that are:
- Important to the customer: Does this actually influence the sale?
- Observable: Can we actually measure or see this in the market?
- Actionable: Can we change our product or messaging to move our position?
Leveraging AI in Your Competitive Positioning Map
In the past, building a comprehensive competitive positioning map took 6 to 10 hours of manual research. Today, AI-enhanced processes can reduce that time by approximately 97%, turning a full day’s work into a 20-minute task.
Modern platforms allow for Competitor Positioning Maps Powered by AI, which use automated signal fusion. This means the AI pulls in product claims, pricing updates, SEO visibility, and social proof in real-time. You can score your brand with AI-powered competitive analysis to get a “confidence score” on how accurate your data is.
AI doesn’t just plot dots; it performs white-space detection. It can scan thousands of customer reviews to find a specific pain point that no competitor is currently addressing—giving you a head start on your next product feature.
Identifying Market Gaps and White Space
One of the most exciting parts of mapping is finding “White Space”—the areas where customer demand exists but no one is currently playing. Companies that use positioning maps systematically are 2.5x more likely to identify these new market opportunities.
Consider the educational platform Product Pathways. By mapping the market, they might find a gap between “Broad, expensive multi-day courses” and “Cheap, low-quality YouTube videos.” That middle ground—deep-dive, self-paced, high-quality online courses—is a classic white space opportunity.
When you find a gap, you can stop fighting in a “Red Ocean” (where competitors are tearing each other apart over price) and move into a “Blue Ocean” of uncontested market space. This is how you master the 5 forces of competition—by choosing to play where the competition isn’t. You can even use a competitive content gap finder to see where your rivals are failing to educate their customers, allowing you to swoop in and own the conversation.
Interpreting the Map: Clusters, VEL, and Real-World Rivals
When you look at your finished competitive positioning map, you’ll notice certain patterns.
Clusters are groups of companies positioned very closely together. If you find yourself in a cluster, you are likely competing on price, which is a race to the bottom. To position your brand so competitors cry, you need to find a way to break away from the pack.
The Value Equivalence Line (VEL) is a diagonal line on the map where the price perfectly matches the perceived benefit.
- Brands above the VEL provide more benefit for the price (a “great deal”).
- Brands below the VEL are considered “overpriced” for what they offer.
Bubble sizes can also be used to represent market share or revenue. For example, in the beverage world, 69% US market share for Coca-Cola would be represented by a massive bubble compared to Pepsi’s 27%.
We see these rivalries everywhere:
- Apple vs. Samsung: Apple positions on “Exclusivity and Ecosystem,” while Samsung often positions on “Versatility and Open Customization.”
- Nike vs. Adidas: Nike dominates with a massive $29 billion in revenue, positioning on “Athletic Performance,” while Adidas often leans into “Lifestyle and Fashion” collaborations to differentiate.
Best Practices and Tools for Strategic Success
A competitive positioning map is not a “one and done” project. Markets move. Competitors launch new features. Customers change their minds. We recommend a quarterly refresh of your maps to ensure you aren’t making decisions based on last year’s news.
To get the best ROI, your map should lead to specific actions. If the map shows you are perceived as “Too Expensive,” your next move might be a pricing adjustment or a marketing campaign focused on your high-end features. This type of strategic clarity often leads to win-rate improvements and a reduction in deal cycles because your sales team knows exactly how to handle objections.
Avoid these common mistakes:
- Wishful Positioning: Placing your brand where you want it to be rather than where the data says it is.
- Internal Bias: Only using input from your own team instead of actual customer feedback.
- Static Analysis: Failing to update the map when a new disruptor enters the market.
By using AI competitive insights to outsmart your rivals, you can stay ahead of these shifts. You should also explore the ultimate guide to market positioning models to see which specific framework fits your industry best.
Essential Tools for a Competitive Positioning Map
You don’t need a massive budget to start mapping, but the right software makes it much easier.
- For Manual Mapping: Google Drawings, GIMP, or Photoshop are great for simple 2×2 matrices.
- For Competitive Intelligence: Tools like Klue and Kompyte help track competitor moves automatically.
- For Data and SEO: SEMrush is essential for seeing where your competitors are winning in the digital landscape.
- For Specialized Analysis: MaxVerdic can help automate the visualization process.
There are many ai-competitive-analysis-tools that make you look like a genius, so don’t be afraid to experiment with automation to save time.
Frequently Asked Questions about Competitive Positioning Maps
How does a positioning map differ from a perceptual map?
While they are very similar, a perceptual map is strictly about consumer feelings and perceptions (e.g., “Is this brand cool?”). A competitive positioning map often includes more objective, measurable criteria like price, technical specifications, or market share.
How often should we update our competitive landscape visuals?
In stable industries, every six months is usually enough. However, in fast-moving sectors like tech or e-commerce, we recommend a quarterly refresh. If a major competitor launches a new product or undergoes a rebrand, you should update your map immediately.
What are the most common mistakes when choosing axes?
The biggest mistake is choosing axes that don’t actually matter to the customer. For example, a software company might choose “Coding Language” as an axis, but the customer only cares about “Ease of Use.” Always validate your axes with customer interviews or survey data.
Conclusion
The market is a complex maze, but you don’t have to navigate it blindly. A competitive positioning map acts as your strategic GPS, showing you exactly where the roadblocks are and where the open road lies. By moving away from internal assumptions and toward data-driven visuals, you can identify the white space that leads to true growth.
At Clayton Johnson SEO, we understand that positioning is everything—especially in crowded markets. We provide specialized SEO strategies tailored for wealth management firms, helping them find their unique “white space” in a highly competitive industry.
If you’re ready to stop guessing and start winning, master your market with a professional competitive analysis. Let us help you map out a path to dominance that leaves your competitors in the rearview mirror.