Stop Sinking and Start Sailing with the Pirate Metrics Growth Framework
What is the Pirate Metrics Growth Framework?
What is the pirate metrics growth framework?
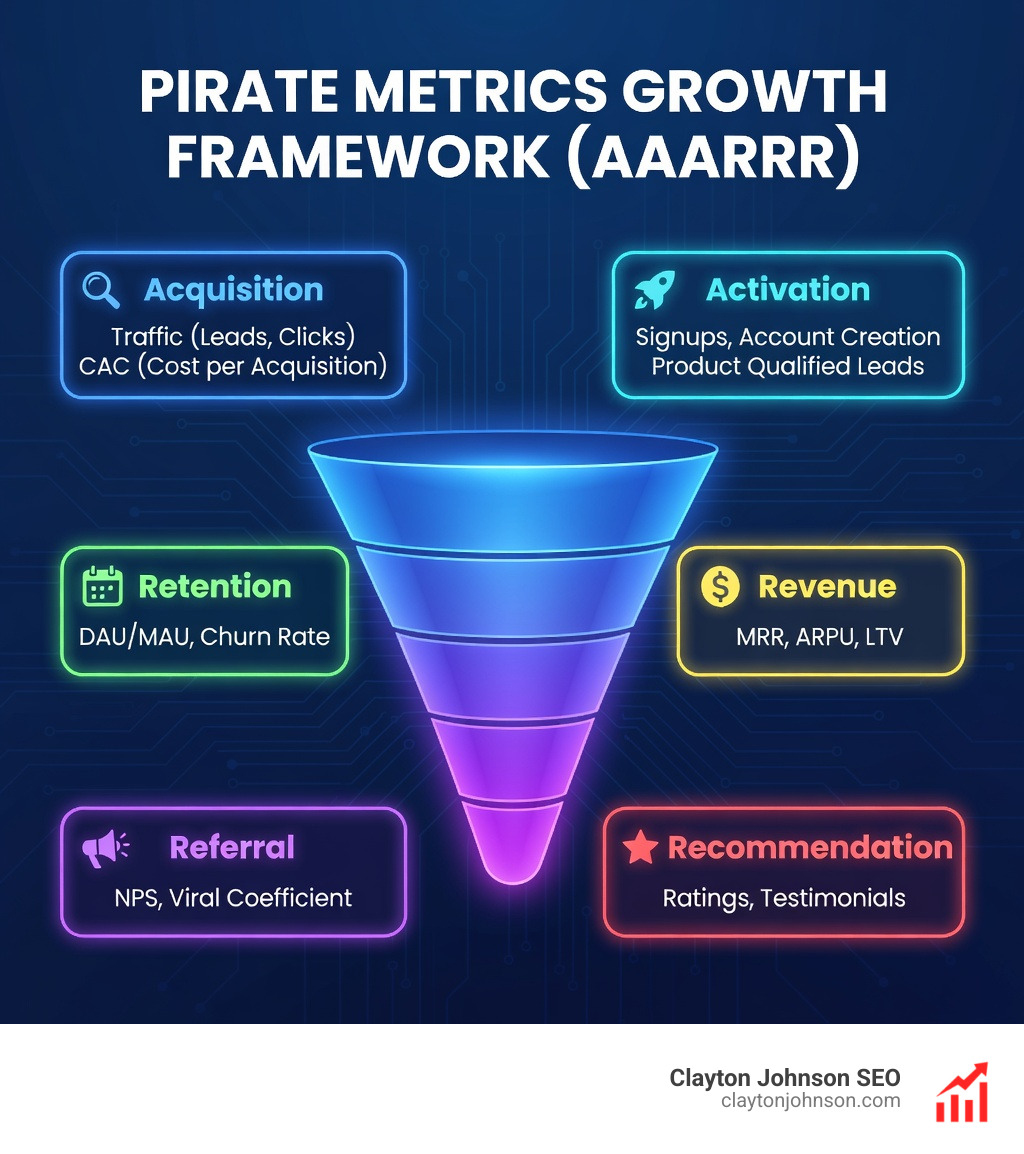
The pirate metrics growth framework (AARRR) is a simple way for businesses to track customer behavior. It breaks the customer journey into five key stages:
- Acquisition: How new users discover your product or service.
- Activation: When users first get value from your product (the “aha!” moment).
- Retention: How many users keep coming back and engaging.
- Referral: When users like your product enough to tell others about it.
- Revenue: How your business makes money from its users.
This framework was developed by Dave McClure.
The pirate metrics growth framework is an essential tool for any business seeking sustainable growth. It offers a clear, structured map of your customer’s journey. This helps you stop guessing and start making data-driven decisions.
Think of it as your compass on the sea of business. It shows you exactly what’s working and what needs improvement. The framework’s playful name, “Pirate Metrics,” comes from its memorable AARRR acronym – like a pirate’s hearty shout!
This simple approach moves businesses beyond just attracting customers. It builds a strong foundation for long-term success by focusing on what truly matters.
As Clayton Johnson, I specialize in architecting the systems that drive inevitable growth. The pirate metrics growth framework is a cornerstone of my approach, helping founders and marketing leaders diagnose problems and engineer scalable traffic systems.


Before the pirate metrics growth framework took the world by storm, many startups were drowning in “vanity metrics.” These are numbers that look good on a slide deck—like total page views or raw social media followers—but don’t actually tell you if your business is healthy.
Dave McClure, the founder of 500 Startups, devised a solution. He realized that for a startup to survive, it needed to focus on the specific behaviors that lead to sustainable revenue. He introduced the world to AARRR in a blog introducing the AARRR pirate metrics framework, providing a five-stage model that simplified the overwhelming world of data.
At its core, the pirate metrics growth framework is a diagnostic tool. It allows us to look at a business and say, “Where is the leak?” Are we getting plenty of visitors but no one is signing up? That’s an acquisition-to-activation problem. Are people signing up but never coming back? That’s a retention problem. By categorizing user behavior into these five pillars, we create a shared language across marketing, product, and engineering teams.
Breaking Down the 5 Pillars of the AARRR Funnel

To truly master the pirate metrics growth framework, we have to look past the acronym and understand the micro-conversions happening at every step. Each stage represents a shift in the user’s relationship with your brand. To help you choose the right combination of metrics for your specific model, you can consult resources like The Amplitude Guide to Product Metrics.
Acquisition: How Users Find You
Acquisition is the “How do people find us?” stage. It encompasses every channel we use to drive traffic to our site or app. However, in the pirate metrics growth framework, acquisition isn’t just about volume; it’s about qualified entry.
We track metrics like:
- Organic Search Traffic: How well our SEO strategy is performing.
- Customer Acquisition Cost (CAC): How much we spend to get one new user.
- PPC Click-Through Rates: The effectiveness of our paid ads.
If you’re looking to scale this stage, our SEO content marketing services focus on building authority-building ecosystems that drive high-intent users rather than just empty clicks.
Activation: Delivering the “Aha” Moment
Activation is arguably the most exciting stage. It’s when a user goes from “just looking” to “this is actually useful.” This is often called the “Aha!” moment.
For Facebook, the “Aha!” moment was discovered to be when a user gained 7 friends within their first few days. For a SaaS company, it might be when a user completes their first project or integrates their first data source.
- Metric to watch: Activation rate (percentage of acquired users who take the “Aha” action).
- Focus: Onboarding flow and Time to Value (TTV). The faster we can get a user to experience value, the more likely they are to stay.
Retention: The Most Critical Pirate Metrics Growth Framework Stage
If your funnel is a bucket, retention is the material the bucket is made of. If you have poor retention, you have a “leaky bucket.” No matter how much water (acquisition) you pour in, it will eventually run dry.
Retention is often considered the most important metric because it validates that your product actually solves a problem. High retention leads to a higher Customer Lifetime Value (CLV) and makes your acquisition spend much more efficient. Research shows that flat Retention Curves indicate Market Product Fit; if your curve never flattens out, you haven’t found the right product-market match yet.
Referral: Turning Users into Advocates
Referral is the stage where your users become your marketing team. This is the ultimate “cheat code” for growth because it reduces your CAC toward zero.
We measure this using the Viral Coefficient. If one user refers, on average, more than one other user (a coefficient greater than 1.0), your growth becomes exponential. While a coefficient above 1 is rare and hard to sustain, even a 0.2 or 0.5 coefficient significantly boosts your growth.
A classic example is how Dropbox enjoyed massive success by offering free storage in exchange for referrals, growing from 100,000 to 4 million users in just 15 months.
Revenue: Monetizing the User Journey
At the end of the day, we are running a business. Revenue metrics tell us if our growth is sustainable. We look at:
- Monthly Recurring Revenue (MRR): For subscription models.
- Average Revenue Per User (ARPU): How much each user is worth.
- Payback Period: How long it takes to earn back the cost of acquiring a customer.
Optimizing this stage often involves price testing and reducing friction at the point of purchase. For those needing help here, our conversion optimization services are designed to turn more of those “activated” users into paying customers.
Why AARRR is Superior to Traditional Marketing Funnels

Traditional marketing funnels, like the AIDA model (Awareness, Interest, Desire, Action), were developed by E. St. Elmo Lewis. While AIDA is great for advertising, it’s insufficient for modern, product-led businesses.
The pirate metrics growth framework is superior because it focuses on the entire customer lifecycle, especially what happens after the first purchase. Traditional funnels often stop at “Action” (the sale). AARRR recognizes that in a SaaS or subscription world, the sale is just the beginning.
By focusing on Retention and Referral, AARRR builds a “growth loop” rather than a linear funnel. It encourages us to build products that people love so much they keep paying and tell their friends. This holistic approach is the foundation of structured growth architecture.
Implementing the Pirate Metrics Growth Framework in Your Business

Implementation doesn’t happen overnight. It requires a shift from “gut-feeling” marketing to data-driven experimentation. Here is how we recommend getting started.
Setting Up Your Tracking Infrastructure
You cannot manage what you do not measure. The first step is implementing a robust analytics stack.
- Google Analytics: Great for the Acquisition stage.
- Mixpanel or Amplitude: Essential for tracking event-based behavior like Activation and Retention.
- Statsig: Excellent for feature flagging and A/B testing your hypotheses. You can find their technical Docs here.
The goal is to create a “Single Source of Truth.” We often use a star schema or a uniform data model to ensure that an “activated user” means the same thing to the marketing team as it does to the product team. If you need a partner to set this up, explore our analytics and data services.
Scaling with the Pirate Metrics Growth Framework
Once the data is flowing, we move into the growth process. This involves:
- Identifying the Bottleneck: Use your AARRR dashboard to find the stage with the biggest drop-off.
- Forming Hypotheses: “If we simplify the signup form, our Activation rate will increase by 10%.”
- Testing: Run A/B tests to validate your ideas.
- The 80/20 Rule: Dave McClure famously suggested spending 80% of your effort optimizing existing features and only 20% on new ones.
This requires cross-functional growth teams—pods that include a marketer, a developer, and a designer all working toward a single metric.
Overcoming Common Challenges in AARRR Implementation
Even with the best intentions, implementing the pirate metrics growth framework can hit snags. One of the most common is “Data Silos,” where the marketing team only cares about clicks and the product team only cares about features.
Another danger is the Product Death Cycle, a term originally coined by David Bland. This happens when a company sees growth slowing and thinks the answer is “more features.” They build a feature, get a small spike in interest, and then growth flattens again. They repeat this until the product is bloated and the business is dead.
To avoid this, we must combine qualitative measurements with quantitative measurements with your own intuition. Numbers tell you what is happening, but talking to your customers (qualitative) tells you why.
Frequently Asked Questions about Pirate Metrics
Who created the AARRR framework and why?
Dave McClure, the founder of 500 Startups, created the framework. He wanted to help founders focus on the metrics that actually impact business health rather than getting distracted by vanity metrics.
What is the difference between AARRR and RARRA?
RARRA is a “remixed” version of the framework that stands for Retention, Activation, Referral, Revenue, and Acquisition. It argues that for mobile apps and highly competitive markets, you should focus on Retention first. If you can’t keep users, there is no point in acquiring them. We view them as two sides of the same coin; AARRR is the journey, while RARRA is a prioritization strategy.
How do you calculate a viral coefficient?
The viral coefficient (K) is calculated by multiplying the number of invitations sent by the average conversion rate of those invitations. For example, if 100 users send 200 invites (2 invites per user) and 25% of those people sign up, your coefficient is 2 * 0.25 = 0.5.
Conclusion
The pirate metrics growth framework is more than just a catchy acronym; it is a structured growth architecture. It allows us to move away from chaotic marketing tactics and toward a compounding growth engine. By focusing on the entire customer journey—from the first touchpoint to the final referral—we build businesses that aren’t just “tugboats” struggling to move, but “smooth sailers” that catch the wind of market demand.
At Demandflow.ai, we believe that clarity leads to structure, and structure leads to leverage. Whether you are in Minneapolis or scaling a global SaaS, the principles of AARRR remain the same: measure what matters, fix the bottlenecks, and never stop experimenting.
If you are ready to stop sinking and start sailing, work with me to build your structured growth infrastructure today.