Surveying the Field with a Competitive Landscape Map
You Can’t Win a Game You Can’t See
A competitive landscape map is a visual tool that shows where your business stands relative to every other option your customers could choose — direct rivals, indirect alternatives, and even the “do nothing” option.
Here’s what it captures at a glance:
- Who your real competitors are — direct, indirect, emerging, and status quo
- How they position themselves — pricing, messaging, target audience, features
- Where the gaps are — underserved segments and open market space
- Where you have a strategic edge — and where you’re exposed
It’s not just a list of rival companies. It’s a picture of the entire battlefield.
Most businesses know their top two or three competitors. But that’s rarely the full picture. Customers don’t just compare you to similar products — they compare you to every alternative, including spreadsheets, freelancers, or simply doing nothing at all.
That blind spot is expensive. Research shows that sellers face competitors in roughly 68% of deals, and many teams only discover a new competitor after losing three to five deals to them. By then, the damage is done.
A competitive landscape map changes that. Instead of reacting, you get to anticipate.
It gives your team a shared focal point — a single visual that answers the question every CEO eventually asks: “Who are we really competing against, and why should customers choose us?”

Building a High-Impact Competitive Landscape Map
When we set out to build a competitive landscape map, we aren’t just making a “pretty picture.” We are constructing a diagnostic tool. Unlike a traditional spreadsheet that lists features in a vacuum, a map provides spatial context. It shows clusters where everyone is fighting for the same scrap of market share and “white space” where no one has planted a flag.
To build a map that actually drives strategy, we must look beyond the obvious. We categorize the players into four distinct buckets:
- Direct Competitors: These are the companies offering a similar solution to the same target audience. If you sell CRM software for small businesses, these are the other CRM brands your prospects mention on sales calls.
- Indirect Rivals: These players solve the same problem but with a different approach. For a project management tool, an indirect rival might be a simple Excel spreadsheet or a physical whiteboard.
- Emerging Threats: These are the “stealth” competitors—startups or companies from adjacent industries that are beginning to creep into your territory. Think of how Netflix was once just a “mail-order DVD company” to Blockbuster.
- The Status Quo: This is often the toughest competitor. It’s the customer’s decision to “do nothing” or keep using their current, albeit broken, internal process.
The Foundations of Strategy
To ensure our map has teeth, we lean on established strategic pillars. Michael Porter of Harvard Business School taught us that competition isn’t just about rival firms; it’s about the structural forces of the industry, including the power of suppliers and the threat of new entrants.
Similarly, the Boston Consulting Group growth-share matrix helps us categorize products as “Stars” (high growth, high share) or “Cash Cows” (low growth, high share). When we apply these frameworks to our map, we stop guessing and start analyzing the strategic landscape with precision.
| Competitor Type | Definition | Example (for a Coffee Shop) | Strategic Focus |
|---|---|---|---|
| Direct | Same product, same audience | The local Starbucks or indie cafe | Feature/Price parity |
| Indirect | Different product, same need | Energy drinks or home brewing kits | Value proposition shift |
| Status Quo | Doing nothing/Existing habit | Drinking tap water or skipping caffeine | Education/Friction reduction |
| Emerging | New tech/Business model | Subscription-based caffeine pills | Innovation monitoring |
Identifying Key Players for Your Competitive Landscape Map
How do we find the names that belong on our map? We don’t just guess. We use a data-driven approach to uncover the rivals that are actually stealing our revenue.
- CRM Data & Win-Loss Analysis: This is our most valuable source. We look at “Competitor” fields in our CRM and analyze “Loss” notes. If a specific name keeps popping up in deals we lose, they are a primary target for the map.
- Customer Interviews: We ask churned customers: “What did you switch to?” The answer is often an indirect competitor we hadn’t even considered.
- Public Disclosures: For larger rivals, we dive into SEC filings. Their 10-K reports often list their own perceived “Risk Factors,” which essentially names the competitors they are most afraid of.
- AI Search Tools: We use tools like Perplexity to scan the web for “alternatives to [Our Product]” or to summarize recent industry news. This helps us spot emerging players before they hit our sales radar.
By gathering this intelligence, we can stop guessing and start positioning based on reality, not assumptions.
Frameworks to Visualize Your Competitive Landscape Map
A map is only as good as its coordinates. To make the data digestible, we use specific visualization frameworks:
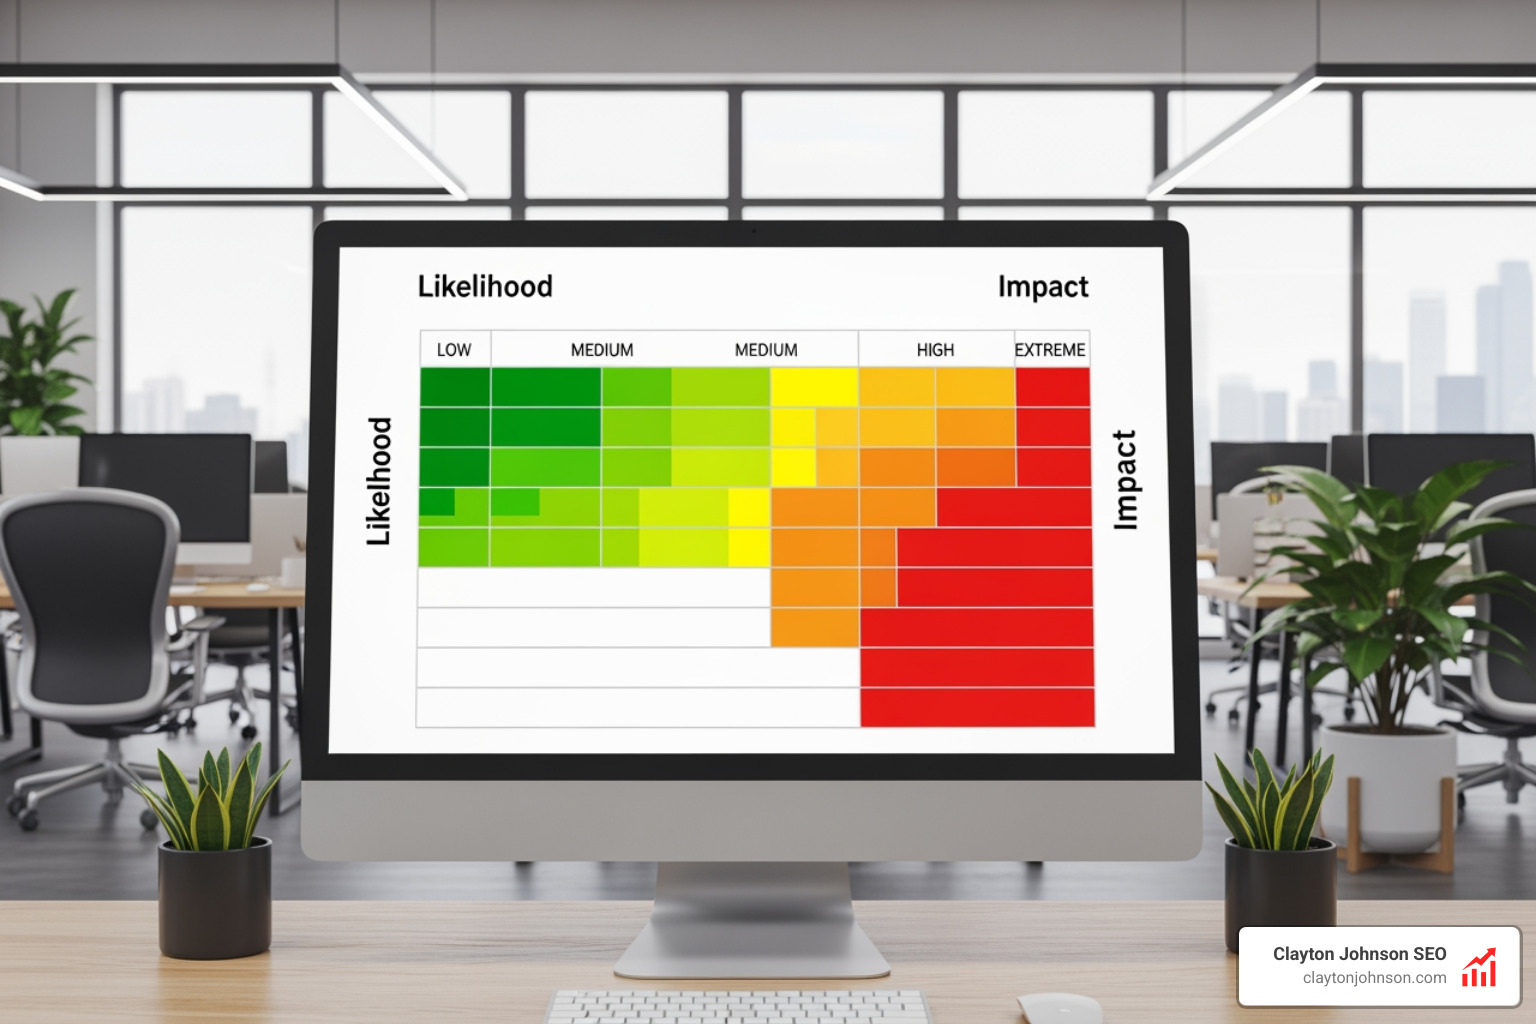
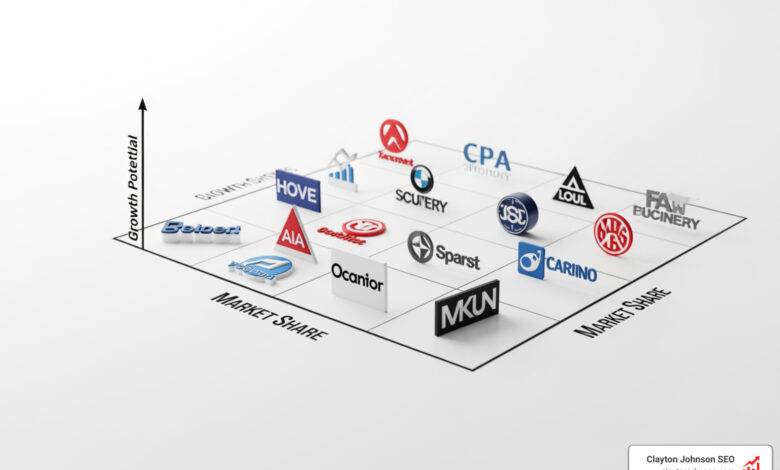
- The 2×2 Positioning Map: This is the classic “Magic Quadrant” style. We choose two axes that matter most to our customers—for example, “Ease of Use” vs. “Feature Depth” or “Price” vs. “Innovation.” This immediately reveals where the market is crowded and where it’s empty.
- Scored SWOT Analysis: We don’t just list bullet points. We score our strengths and weaknesses on a scale of 1-5. This allows us to demystify the positioning map by showing the magnitude of our advantages.
- Wardley Maps: Inspired by Simon Wardley, these maps look at the “evolution” of components. They help us see if a competitor is winning because they’ve turned a once-complex feature into a commodity.
- Jobs to be Done (JTBD): Following the HBR Jobs to be Done framework, we map competitors based on the job the customer is hiring them to do. This often reveals that our biggest competitor isn’t another software company, but a manual process the customer is comfortable with.
Leveraging AI and Modern Tools for Real-Time Insights
The days of the “static PDF” competitive analysis are over. In the modern SaaS environment, a competitor can change their pricing or launch a new feature overnight. We need a living system.
Modern tools allow us to automate the “grunt work” of data collection. We use machine learning to scan competitor websites for messaging changes, monitor social media sentiment, and summarize thousands of G2 or Capterra reviews in seconds.
By scoring our brand with AI-powered analysis, we can identify patterns that a human might miss. For example, AI might notice that while we lead in “Features,” our competitors are winning on “Customer Support” sentiment. We can then use these AI insights to adjust our roadmap in real-time.

Operationalizing Your Analysis for Long-Term Growth
A competitive landscape map shouldn’t sit in a folder. It should be the “living radar” for the entire organization. When we operationalize this map, it informs every department:
- For Sales: It provides the narrative. If a rep knows a prospect is looking at “Competitor B,” they can use the map to highlight the specific areas where we have a strategic edge.
- For Product: It prevents “feature parity” traps. Instead of just copying what rivals build, the product team looks at the map to find gaps that no one is filling.
- For Marketing: It defines the “Blue Ocean.” Instead of fighting in a red ocean of identical messaging, marketing can craft a story that is uniquely ours.
By visualizing our competitive edge, we ensure that everyone in the company is moving in the same strategic direction.
Integrating Customer Forces and Value Drivers
To make our map truly topographical, we need to understand the “elevation” of the market. This involves looking at the forces acting on the customer.
We use metaphors like “hills” to represent the effort required to switch.
- Push: The pain of the current situation.
- Pull: The attraction of our new solution.
- Friction: The difficulty of getting started.
- Inertia: The comfort of the status quo.
Using the Harvard Business Review Value Stick, we can visualize the “wedge” between a customer’s willingness to pay and a supplier’s cost. A great competitive landscape map shows not just where companies are, but where the “gravity” of the market is pulling customers. Mastering these five forces of competition is what separates market leaders from also-rans.
Avoiding Common Pitfalls in Market Mapping
Even the best intentions can lead to a useless map if we aren’t careful. We’ve seen many teams fall into these traps:
- Static Data: Markets move fast. A map that isn’t updated at least quarterly becomes a historical artifact rather than a strategic tool.
- Feature Obsession: As Hunter Sones often points out, obsessing over a checklist of features causes you to miss the bigger picture of positioning and customer experience.
- Confirmation Bias: We often tend to map only the competitors we want to beat, ignoring the “annoying” startup that is actually gaining ground.
- Ignoring the “Do Nothing” Option: We must remember that for many customers, the biggest competitor is their own inertia.
Understanding how to think about competitive pressure means recognizing that threats often come from where you least expect them.

Conclusion: Turning Insights into a Scalable Growth Engine
At Clayton Johnson SEO, we believe that strategy without structure is just noise. A competitive landscape map is the architectural drawing for your growth. It provides the clarity needed to make hard choices—deciding where to play and, more importantly, where not to play.
By building these durable systems—from technical SEO architecture to AI-augmented competitive analysis—we help founders and operators turn fragmented efforts into coherent growth engines. The goal is compounding growth: where every insight from your map makes your next marketing campaign or product launch more effective.
If you’re ready to stop guessing and start building a system-level view of your market, we can help. Clarity leads to structure, and structure leads to leverage.
Contact Clayton Johnson today to start building your strategic edge.