The Metrics That Make or Break Your Lean Canvas
Why Lean Canvas Key Metrics Separate Winners From Failures
Lean Canvas key metrics are the quantifiable performance indicators that measure whether your startup is moving in the right direction—or burning cash without traction.
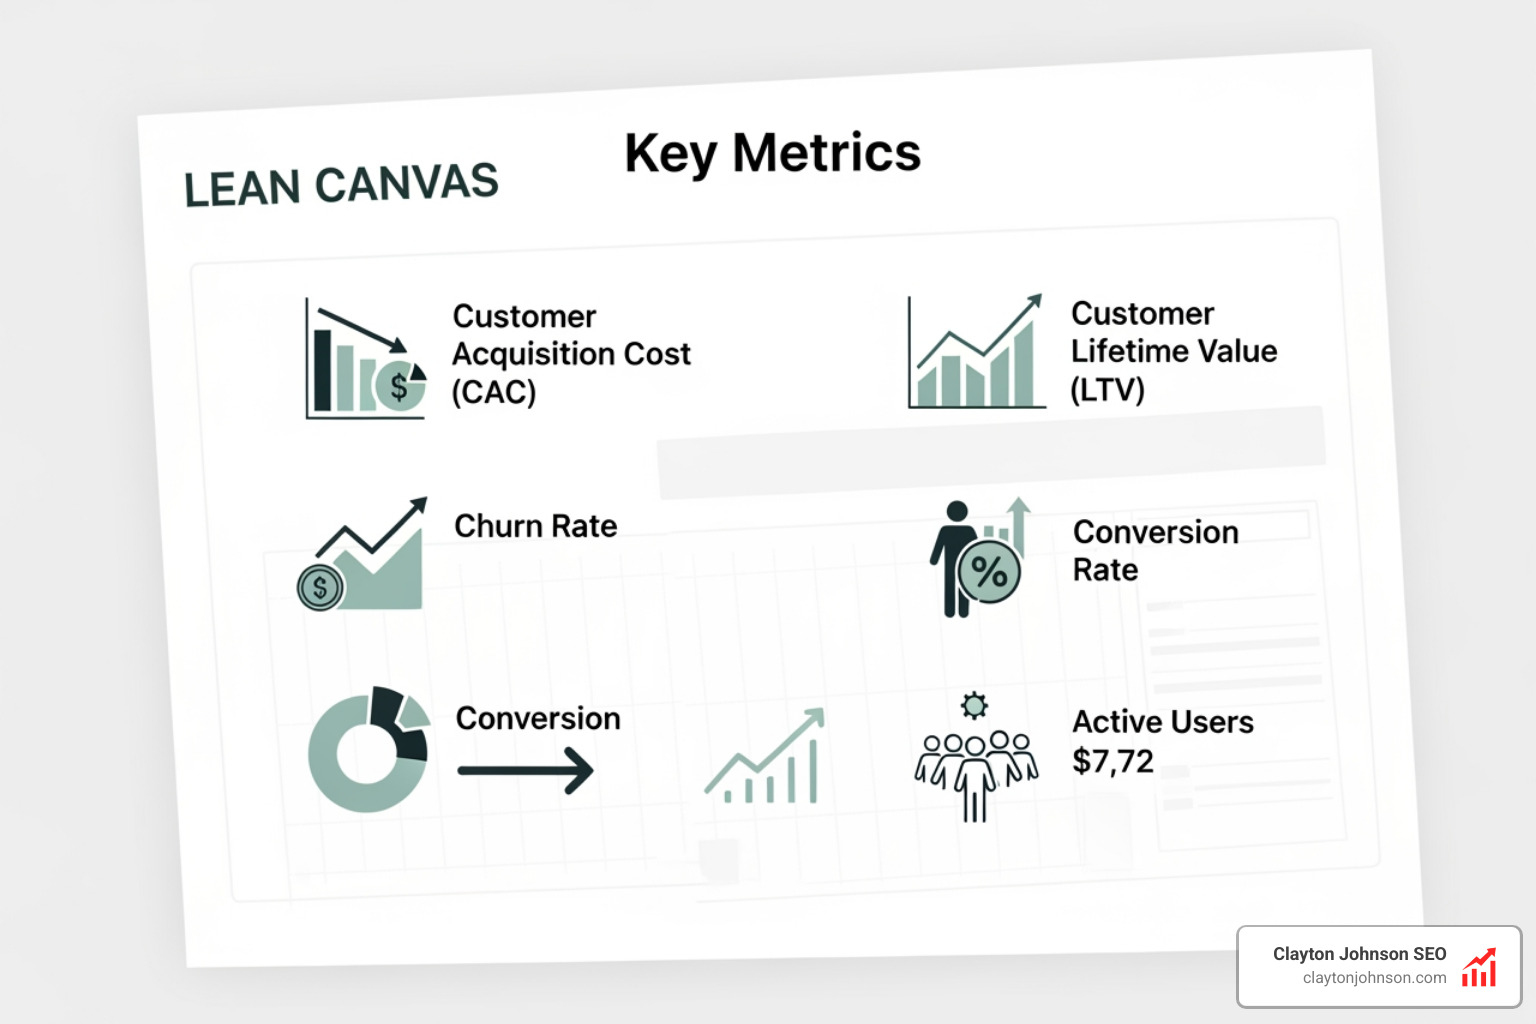
Quick Answer: The 5 Core Lean Canvas Key Metrics
- Customer Acquisition Cost (CAC) – What you spend to acquire each customer
- Customer Lifetime Value (LTV) – Total revenue a customer generates over their lifetime
- Monthly Recurring Revenue (MRR) – Predictable monthly income (for subscription models)
- Churn Rate – Percentage of customers who stop using your product
- Conversion Rate – Percentage of prospects who become paying customers
These metrics answer one critical question: Are we building something people actually want?
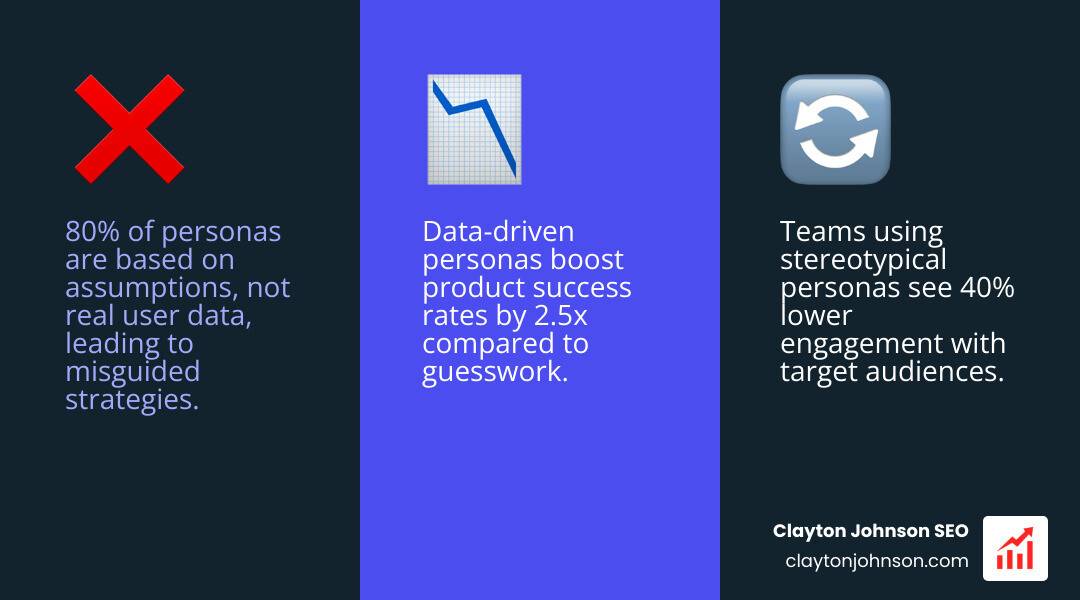
The stakes couldn’t be higher. Research shows that 42% of startups fail because they build products nobody needs—a problem that proper metrics validation could prevent. Meanwhile, 73% of founders build the wrong thing when they skip systematic measurement. The difference? Founders who use structured frameworks like the Lean Canvas with disciplined metric tracking achieve revenue within 90 days versus the 8+ month average.
Most founders start with passion and hope. They build for months, then discover customers don’t want what they built. Metrics provide the early warning system that prevents this expensive mistake.
Think of Lean Canvas key metrics as your startup’s vital signs. Just like a doctor monitors heart rate and blood pressure to assess health, you need specific numbers that tell you whether your business model is viable—before you run out of runway.
I’m Clayton Johnson, and I’ve helped dozens of startups and growth-stage companies identify which metrics actually drive business outcomes and which are just noise. Throughout my work building structured SEO and growth systems, I’ve seen how the right Lean Canvas key metrics can transform vague hypotheses into testable, actionable strategies that compound over time.

Key terms for Lean Canvas key metrics:
What are Lean Canvas Key Metrics?

In the Lean Canvas framework, the “Key Metrics” box isn’t just a place to list numbers; it’s a strategic tool for assessing your positioning. These metrics are pivotal indicators that transcend mere digits—they serve to evaluate your momentum and direction.
When we use the online Lean Canvas tool, we are doing more than filling out a form. We are capturing a snapshot of our business model at a specific point in time. The Lean Canvas is used by over 1 million entrepreneurs worldwide, and for good reason. It forces us to distill our complex ideas into nine essential building blocks.
The “Key Metrics” section is typically the eighth box filled in the sequence. It’s placed there because it acts as a bridge between your product (the left side of the canvas) and your market (the right side). Without these metrics, you’re essentially navigating without a GPS or piloting a plane without gauges.
Defining Lean Canvas key metrics
We like to think of these as the “vital signs” of your business health. They are the 3-5 critical numbers that tell you if your experiment is succeeding. If you are in the early stages, your metrics shouldn’t be about profit yet; they should be about measurable progress in validating your hypotheses.
For example, if your hypothesis is that people have a specific problem, your key metric might be the number of people who signed up for a waitlist after reading your problem statement. This is a far more reliable indicator of interest than a casual “that sounds cool” during a coffee chat. If you’re struggling to find that initial traction, it might be time for a deeper dive into customer discovery services.
Why metrics are the pulse of your startup
Metrics shape behavior. It’s a simple truth: what you measure is what you become. If you measure cost savings, you’ll become a penny-pinching machine. If you measure customer satisfaction, you’ll become a service-oriented powerhouse.
With a 42% failure rate due to “no market need,” metrics provide the data-driven foundation for resource allocation. Instead of guessing where to spend your next $1,000, your metrics tell you exactly which channel is converting or where users are dropping off in your funnel. By blending Lean Startup and BMC for success, we can ensure that every hour of work is moving the needle.
Identifying Meaningful Metrics vs. Vanity Metrics
One of the biggest traps we see founders fall into is the “ego trap.” It’s easy to feel successful when your website traffic is up 50%, but if none of those visitors are buying, that number is a vanity metric.
| Feature | Vanity Metrics | Actionable Metrics |
|---|---|---|
| Purpose | Inflate ego, look good in PR | Drive strategic decisions |
| Clarity | Vague (e.g., “Total Downloads”) | Specific (e.g., “Daily Active Users”) |
| Action | No clear next step | Tells you what to fix or scale |
| Reliability | Easy to manipulate | Hard to “fake” success |
To avoid the 73% of founders who build the wrong thing, we recommend using Dave McClure’s Pirate Framework (AARRR). This framework ensures you are tracking the entire customer journey:
- Acquisition: How do people find you?
- Activation: Do they have a great first experience?
- Retention: Do they come back?
- Referral: Do they tell others?
- Revenue: Do they pay you?
Selecting Lean Canvas key metrics for your model
Meaningful metrics are actionable, accessible, and auditable. An actionable metric is one that demonstrates cause and effect. If you change the headline on your landing page and your conversion rate jumps from 2% to 5%, that is actionable data.
Think about the Pfizer patent unfair advantage example. While a patent is a legal protection, the metric Pfizer tracks isn’t just “number of patents.” It’s the revenue generated from those exclusive products versus the R&D cost. For your startup, your metric should be an objective yardstick of your unique value.
Avoiding the “ego” trap
Website visits, social media followers, and total registered users often provide a high signal-to-noise ratio. They make for great charts in a slide deck, but they don’t tell you if you have a sustainable business.
We prefer outcome metrics over output metrics. An output is “we wrote 10 blog posts.” An outcome is “those 10 blog posts generated 50 qualified leads.” Always choose the metric that forces you to make a decision. If a metric doesn’t help you decide whether to pivot or persevere, it probably doesn’t belong on your Lean Canvas.
Categories of Metrics: From Leading Indicators to Output Results

To get a holistic view of your performance, we need to categorize our metrics. Not all numbers are created equal; some tell us what happened in the past, while others predict what will happen in the future.
Leading vs. Trailing indicators
- Leading Indicators: These are predictive. They measure the inputs or early actions that lead to future success. For example, “number of sales calls booked” is a leading indicator for “revenue.”
- Trailing Indicators: These are results. They tell you what has already happened. “Monthly Revenue” is a trailing indicator. While important, you can’t change revenue today; you can only change the activities that lead to it.
In our work, we focus heavily on experimentation velocity—how many tests are we running per week? This is a leading indicator of how quickly we will find a profitable growth channel. This is especially relevant when targeting specific demographics. For instance, research on Gen-Z sustainability preferences shows that 3 out of 4 care more about eco-friendliness than brand names. If you’re targeting Gen-Z, a leading indicator might be “engagement on sustainability-focused content.”
Input, Process, and Output frameworks
- Input Metrics: Resources invested (e.g., marketing spend, capital investment, man-hours).
- Process Metrics: Operational efficiency (e.g., lead conversion rate, production throughput, time-to-market).
- Output Metrics: Tangible outcomes (e.g., sales volume, profit margins, user registrations).
By tracking all three, we can diagnose exactly where a business model is breaking. If your inputs are high but your outputs are low, the problem lies in your process. This is why a deep dive into BMC cost structure is so vital—it helps you see where your “process” is leaking cash.
Integrating Key Metrics Across the Lean Canvas Framework

The “Key Metrics” section doesn’t live in a vacuum. It is deeply integrated with every other box on your Lean Canvas.
Metrics and the Unique Value Proposition
Your Unique Value Proposition (UVP) is a promise. Your metrics are the proof that you’re keeping that promise. If your UVP is “the fastest way to book a ride,” your key metric must be “average wait time.”
Look at Apple’s UVP and innovation. Apple focuses on simplicity and design elegance. Their metrics likely include user satisfaction scores and repeat purchase rates, rather than just raw technical specs. If your product aims for a similar high-end experience, your Net Promoter Score (NPS) becomes a vital indicator of whether your UVP is actually resonating with your customer segments.
Connecting metrics to Channels and Revenue
Your Channels are the paths to your customers. We measure their effectiveness using Customer Acquisition Cost (CAC). If it costs you $50 to acquire a customer through Instagram but only $10 through SEO, your metrics are telling you where to allocate your budget.
On the flip side, we have Revenue Streams. The most important relationship in any startup is the LTV to CAC ratio. As a rule of thumb, your Lifetime Value (LTV) should be at least 3x your CAC. If you’re not tracking this, you might be growing yourself into bankruptcy. Mastering BMC channels requires a constant feedback loop between how you reach people and how much they are worth to your business.
Industry Examples: Lean Canvas Key Metrics for Every Business

Different business models require different “vital signs.” Here is how we break them down:
SaaS and Subscription metrics
For a SaaS company, the goal is predictable, recurring growth.
- Monthly Recurring Revenue (MRR): The lifeblood of subscription businesses.
- Churn Rate: The percentage of people leaving. In healthcare SaaS, retention rates average 85%, serving as a key benchmark.
- Activation Rate: The percentage of users who reach the “Aha!” moment.
If you are building a tech product, using the definitive BMC tech startup template can help you map these specific SaaS metrics to your growth stages.
Marketplace and Ad-based metrics
Marketplaces (like Airbnb or Uber) have to balance two sides: buyers and sellers.
- Gross Merchandise Value (GMV): Total value of goods sold through the platform.
- Liquidity: The probability that a seller finds a buyer (and vice versa).
- Take Rate: The percentage of the GMV the platform keeps as revenue.
For ad-based models (like a blog or social network), the focus shifts to attention:
- Daily Active Users (DAU): How many people use the product every day.
- Click-Through Rate (CTR): How effective the ads are at capturing attention.
- Average Revenue Per User (ARPU): Total ad revenue divided by total users.
Common Pitfalls and How to Track Metrics for Growth
Even with the best intentions, it’s easy to get metrics wrong. The most common pitfall is metric overload. We’ve seen founders with dashboards containing 50 different numbers. This dilutes focus. We recommend choosing 3-5 critical metrics that truly matter.
Another pitfall is groupthink. When teams brainstorm metrics together, they often settle on the easiest things to measure rather than the most important. We suggest having team members identify metrics individually first, then reconciling them. This ensures a diversity of perspectives on what defines success. You can explore more about this in our guide on digital innovation via BMC.
Leveraging data for business growth
To grow, you must use your metrics to make “pivot or persevere” decisions. If your metrics show that your CAC is rising while your LTV is stagnant, you have to change something—either your product, your pricing, or your channel.
Tracking these numbers isn’t just for you; it’s for your investor relations. Investors don’t care about your “great idea”; they care about your traction. Showing a consistent, data-backed improvement in your key metrics is the fastest way to secure funding and ensure sustainable growth. At Clayton Johnson SEO, we use these same data-driven principles to ensure our clients aren’t just getting “traffic,” but are seeing measurable business results.
Frequently Asked Questions about Lean Canvas Metrics
Can Lean Canvas help identify startup risks?
Yes. By forcing you to define how you will measure success, the Lean Canvas highlights where you lack data. If you can’t come up with a key metric for your solution, it’s a sign that your solution might not be solving a measurable problem. It helps you identify “no market need” before you’ve spent your life savings.
How many metrics should I track on my canvas?
Stick to 3-5 metrics. Any more than that and you’ll lose focus. You want a “North Star” metric that aligns the whole team, supported by a few secondary metrics that provide context (like a “counter metric” to ensure your primary goal isn’t hurting another part of the business).
What is the difference between output and outcome metrics?
An output metric measures an activity (e.g., “we made 100 sales calls”). An outcome metric measures the result of that activity (e.g., “we closed 5 new customers”). Always prioritize outcome metrics, as they are more closely tied to the actual health of the business.
Conclusion
Mastering Lean Canvas key metrics is about moving from “hope” to “evidence.” By meticulously selecting 3-5 actionable indicators, we can navigate the uncertainty of the startup world with a clear map. Metrics are your compass, not your destination. They tell you where you are so you can make the right decisions to get where you want to go.
If you’re ready to stop guessing and start growing with a data-backed strategy, we’re here to help. Whether you need a deep dive into your competitive landscape or a system to turn your content into a lead-generation machine, our team can help you execute with precision. Work with an SEO consultant today to turn your Lean Canvas hypotheses into measurable results.