Why Your Product Market Fit Survey Questions Might Be Lying to You

The Sean Ellis Test: Decoding the Core Product Market Fit Survey Questions
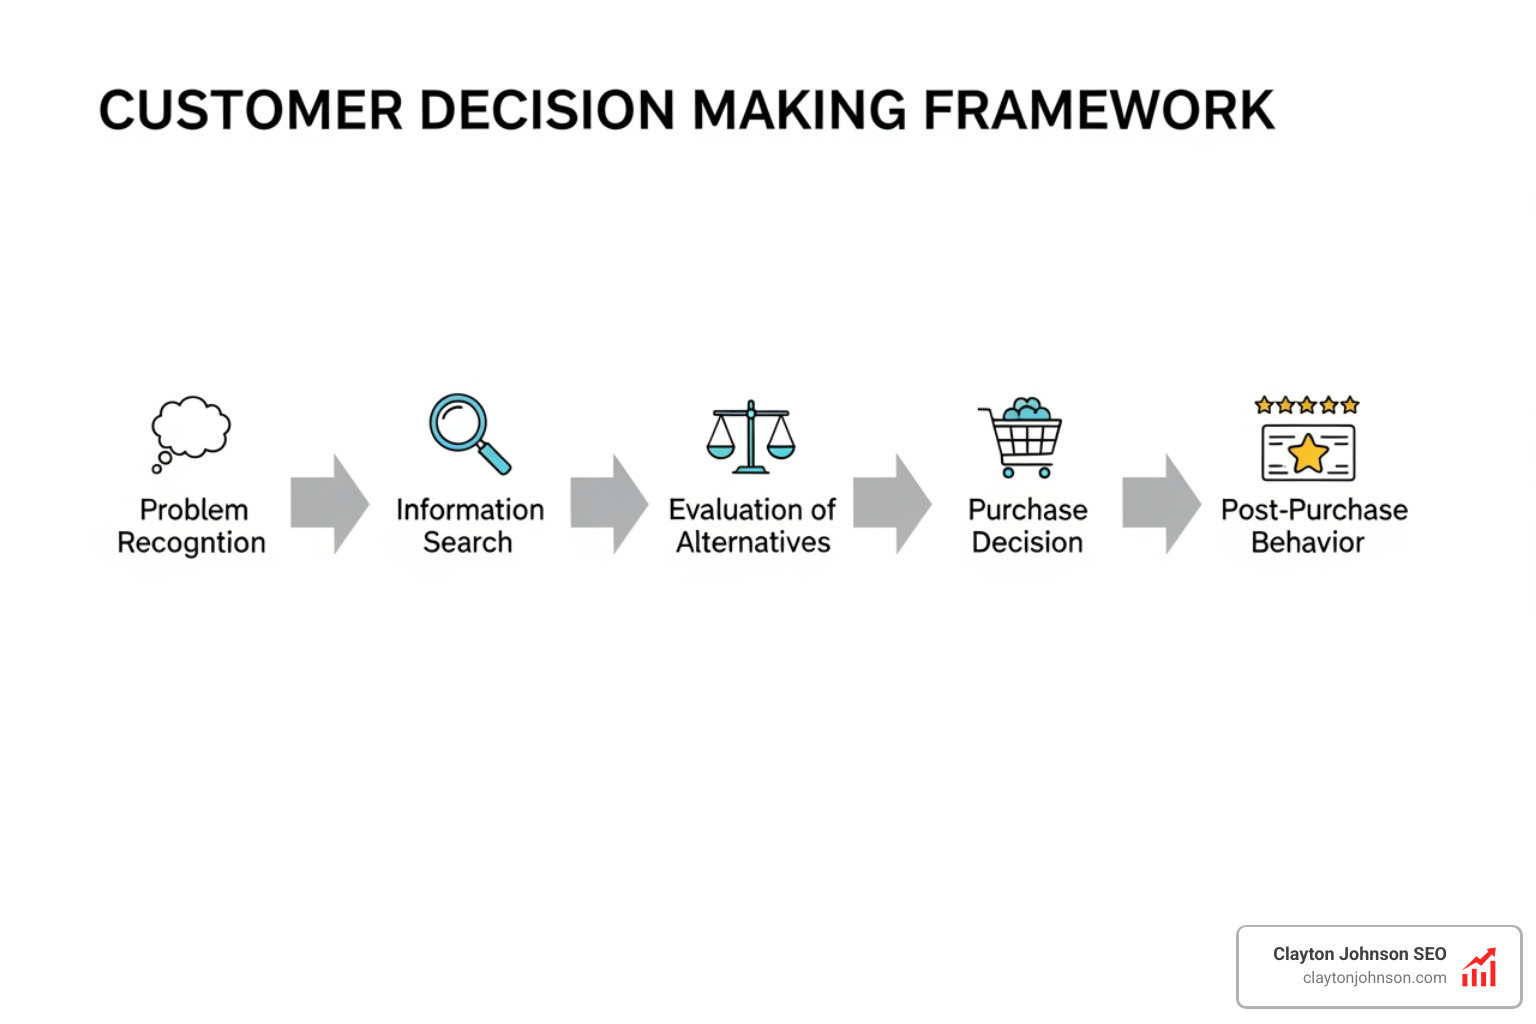
#
Product market fit survey questions are the fastest way to find out if your product is truly a must-have — or just a nice-to-have. Here are the core questions used in a standard PMF survey:
- How would you feel if you could no longer use [product]? (Very disappointed / Somewhat disappointed / Not disappointed / N/A)
- What type of person benefits most from [product]?
- What is the main benefit you get from [product]?
- How can we improve [product] to better meet your needs?
- What would you use as an alternative if [product] were no longer available?
If 40% or more of your active users answer “Very disappointed” to question one, you have a strong signal of product-market fit. Below 40% means it’s time to iterate — not scale.
Most founders run the survey once, see a decent score, and move on. That’s the problem.
A single number can hide more than it reveals. Skewed samples, wrong respondents, and poorly timed surveys can all inflate your score — giving you a false green light to scale before you’re ready. Scaling too early is one of the fastest ways to burn resources without traction.
The good news: the survey itself isn’t broken. How most teams run it is.
I’m Clayton Johnson, an SEO and growth strategist who has helped founders build structured growth systems — including frameworks for measuring and acting on product market fit survey questions as a repeatable diagnostic, not a one-time checkbox. Below, I’ll walk you through exactly where PMF surveys go wrong and how to fix them.

The “Sean Ellis Test” is the gold standard for measuring Product-Market Fit (PMF). It was developed by Sean Ellis after he analyzed nearly 100 startups to find a leading indicator for sustainable growth. We use this test because it moves past “vanity metrics” like sign-ups or page views and gets to the heart of user necessity.
The core of the test is a single, diagnostic question: “How would you feel if you could no longer use [Product]?”
According to the Sean Ellis Model, the magic number is 40%. If 40% or more of your users say they would be “very disappointed” without your product, you have found PMF. This threshold isn’t just a random guess; companies that score above 40% almost always find a path to scale, while those below it tend to struggle with churn and stalled growth.
This question measures “must-have” status. It’s a proxy for customer excitement. When people can’t live without your tool, they become organic advocates. If you’re ready to test your own standing, you can use a Sean Ellis Template to get started.

How to Calculate Your PMF Score
Calculating your score is straightforward, but accuracy requires one critical step: cleaning your data.
To find your PMF score, use this formula:
(Number of “Very Disappointed” responses) / (Total number of valid responses) x 100
“Valid responses” are key here. You must exclude anyone who answered “N/A – I no longer use the product.” These users have already churned and shouldn’t cloud your current fit assessment. We are looking for a directional signal from people who are actually in the product today. For a more automated approach, tools like the PMF Survey Tool can handle the heavy lifting for you.
Interpreting Scores Above and Below 40%
What do these numbers actually mean for your roadmap?
- 40% or Higher (The Green Light): Congratulations, you have a “must-have” product. This is your signal to shift from product iteration to aggressive growth. You have a solid Startup Pyramid base, and it’s time to scale your SEO and marketing efforts.
- Below 40% (The Iteration Phase): This is not a failure; it’s a diagnostic. It means your value proposition hasn’t quite hit the mark for a large enough segment of your audience. If you scale now, you’ll just be “leaking” users through a hole in your bucket. You need to pivot or refine your features before spending more on acquisition.
Beyond the Score: Essential Follow-up Questions for Deep Insight
While the 40% score tells you if you have fit, it doesn’t tell you why. As entrepreneur Hiten Shah often points out, the real gold is in the qualitative data. The score is just the headline; the follow-up questions are the story.
| Metric | Quantitative Score (The 40%) | Qualitative Insights (The “Why”) |
|---|---|---|
| Purpose | Validation of market demand | Direction for product roadmap |
| Outcome | Go/No-Go decision for scaling | Identification of “must-have” features |
| Action | Strategic budgeting | Feature prioritization |
By asking open-ended product market fit survey questions, we can uncover the primary benefit users receive and the specific language they use to describe it. This is essential for building accurate user personas and SEO-driven content that actually resonates. You can find more of Hiten Shah’s Insights on why the “why” matters more than the number.
Identifying Your High-Expectation Customer (HXC)
Not all users are created equal. To find PMF, you often need to ignore the people who don’t get your product and double down on the ones who do. This is the “Superhuman” approach.
When the email startup Superhuman first ran their survey, they only scored 22%. Instead of trying to please everyone, they segmented their data. They looked only at the “Very Disappointed” group to see who they were and what they valued. By focusing on this “High-Expectation Customer,” they iterated their product to meet those specific needs, eventually driving their score up to 58%.
This Superhuman Engine for PMF proves that PMF is a moving target that you can hit through disciplined segmentation.
Analyzing Competitors and Alternatives
One of the most revealing product market fit survey questions is: “What would you likely use as an alternative if [Product] were no longer available?”
If users list a direct competitor, you know exactly who you are fighting for market share. If they say they would use “Excel” or “Pen and Paper,” you’ve identified a market gap where a specialized solution is needed. Understanding these switching costs and alternatives helps refine your unique value proposition. For a deeper look at market dynamics, the Pmarca Guide to Startups offers a classic perspective on why the market is the only thing that matters.

Avoiding the “False Positive” Trap in Your Data
The biggest danger in running a PMF survey is the “False Positive.” This happens when you get a high score that doesn’t actually reflect the broader market.
Common causes of skewed data include:
- Selection Bias: Only surveying your “power users” or friends who want to be nice.
- Vanity Metrics: Focusing on total responses rather than qualified responses.
- Recency Bias: Surveying people who haven’t used the product long enough to form a real opinion.
If your data is skewed, you might think you’re ready to scale when you’re actually heading for a cliff. False Positives Research suggests that many startups fail because they misinterpret early enthusiasm for broad market fit.
Who and When to Ask Product Market Fit Survey Questions
To get a clean signal, you must be picky about who you survey. We recommend only surveying users who:
- Have experienced the core value of the product.
- Have used the product at least twice.
- Have used the product within the last two weeks.
How many responses do you need? A Buffer Study on Response Significance found that 40-50 qualified responses are often enough to see a clear directional signal. You don’t need thousands of answers; you need 50 right answers.
Common Pitfalls in Product Market Fit Survey Questions
Even with the right people, the way you ask matters. Leading questions—like “How much do you love our new feature?”—will always give you “lying” data.
Another pitfall is survey fatigue. If you ask too often or make the survey too long, your busiest (and often most valuable) users will simply ignore it. Justin Jackson on PMF Validity notes that while the 40% threshold is a bit arbitrary, it remains a vital directional tool if you avoid these common traps.
A Step-by-Step Guide to Running Your PMF Survey
Ready to run your own? Here is our structured framework for executing a successful PMF survey.
- Choose Your Tool: Use in-app survey tools like Typeform, Hotjar, or specialized SurveyMonkey PMF Resources to catch users while they are engaged.
- Segment Your Audience: Filter your user list based on the “twice in two weeks” rule.
- Keep it Short: Stick to the core Sean Ellis question plus 3-4 qualitative follow-ups.
- Use Branching Logic: If someone says they are “Not Disappointed,” ask them why. Their feedback might reveal a fatal flaw in your UX.
- Set a Deadline: Collect your 40-50 responses within a week to ensure the data is fresh.
Translating Insights into Actionable Roadmaps
Once the data is in, don’t just file it away. We use this feedback to build a structured growth architecture.
- Analyze the “Very Disappointed” group: What features do they love? Protect these at all costs.
- Analyze the “Somewhat Disappointed” group: What is the one thing holding them back from being “Very Disappointed”? These are your high-impact, low-effort improvements.
- Ignore the “Not Disappointed” group: Trying to win them over often leads to “feature bloat” that confuses your core fans.
This process of High Tempo Testing ensures your roadmap is driven by data, not gut feelings.
Real-World Success: Slack and Superhuman
Success leaves clues. Let’s look at two famous examples:
- Slack: In a 2015 Slack PMF Analysis, they surveyed 731 users. 51% said they would be “very disappointed” without it. This validated their decision to scale rapidly.
- Superhuman: As mentioned, they started at 22%. By using the survey iteratively—asking the questions, making changes, and re-surveying—they climbed to 58%.
These aren’t just stories; they are blueprints for how to use product market fit survey questions to build a world-class product.
Frequently Asked Questions about PMF
How many responses do I need for a reliable PMF survey?
For most startups, 40-50 qualified responses provide a strong directional signal. While 100+ responses offer more statistical confidence, the quality of the respondent (recent, active usage) is more important than the quantity.
How often should I repeat the PMF survey?
We recommend running the survey quarterly or after every major product milestone. This acts as a “health check” to ensure you haven’t lost fit as you add new features or enter new markets.
What should I do if my PMF score is below 40%?
Don’t panic—iterate. Use the qualitative feedback to identify where you are missing the mark. You may need to pivot your target market or remove features that are causing friction. Focus exclusively on the feedback from the “Somewhat Disappointed” group to see what would move the needle for them.
Your Next Best Step: Turn Survey Answers Into Product Decisions
Achieving Product-Market Fit isn’t a stroke of luck; it’s the result of a structured growth architecture. At Demandflow, we believe that clarity leads to structure, and structure leads to compounding growth. By using product market fit survey questions as a diagnostic tool rather than a one-time test, you can stop “shooting in the dark” and start building a product that your market truly demands.
Don’t let your data lie to you. Clean your samples, ask the hard questions, and listen to the “why” behind the numbers.