Why Financial Metrics Are the Foundation of Smart Business Decisions
Financial metrics are measurements derived from your financial statements that tell you how well your business is performing — and where it’s headed.
Here’s a quick snapshot of the key financial metrics every manager should know:
| Metric | What It Measures | Category |
|---|---|---|
| Gross Profit Margin | Revenue after direct costs | Profitability |
| Net Profit Margin | Bottom-line earnings | Profitability |
| Current Ratio | Short-term solvency | Liquidity |
| Debt-to-Equity Ratio | Capital structure risk | Solvency |
| Return on Equity (ROE) | Shareholder value efficiency | Profitability |
| Operating Cash Flow | Cash from core operations | Liquidity |
| Inventory Turnover | Stock management efficiency | Efficiency |
These metrics come from three core documents:
- 📄 Balance Sheet — what you own and owe
- 📈 Income Statement — revenue and expenses
- 💵 Cash Flow Statement — actual cash movement
Most business owners feel cash pressure before they can name the metric causing it. That gap between intuition and data is exactly where financial metrics do their work. They turn gut feelings into measurable signals — and measurable signals into smarter decisions.
Whether you’re a founder at $1M ARR or a VP of Growth managing a $20M pipeline, tracking the right financial KPIs is the difference between reacting to problems and preventing them.
I’m Clayton Johnson — an SEO and growth strategist who works at the intersection of structured strategy, data systems, and scalable execution. I’ve built frameworks across 50+ business models, and financial metrics are consistently the missing layer for founders who have traffic but lack clarity on what’s actually driving (or draining) growth.

What are Financial Metrics and Why Do They Matter?

At their core, Financial Metrics are the vital signs of an organization. Just as a doctor checks your pulse and blood pressure to assess your physical health, we use these metrics to evaluate the stability, profitability, and sustainability of a business.
In our work at Demandflow, we often see companies that are “busy” but not necessarily “healthy.” You might have a “top-line” revenue number that looks impressive on a pitch deck, but if your “bottom-line” profit is non-existent because of runaway costs, you’re essentially running on a treadmill that’s about to break.
Tracking these metrics is essential for several reasons:
- Data-Driven Leadership: Instead of arguing over opinions, teams can align around objective truths found in the Balance Sheet and Income Statement.
- Resource Optimization: When we know which products or services have the highest margins, we can double down on what works and cut what doesn’t.
- Performance Tracking: Metrics allow us to see trends over time. Is our efficiency improving, or are we becoming bloated as we scale?
- Strategic Decision-making: Should we hire more staff in Minneapolis? Should we invest in a new AI-augmented workflow? The answers lie in your Guide to Financial Ratios.
Without these indicators, management is just expensive guesswork. For companies in Minnesota and beyond, staying financially healthy means maintaining the agility to innovate while keeping a firm grip on fiscal reality.
The 5 Core Categories of Financial KPIs
To make sense of the dozens of available ratios, it helps to group them into five primary buckets. Each category answers a different fundamental question about the business.
| Category | Primary Question | Primary Business Objective |
|---|---|---|
| Profitability | Are we making money? | Maximize earnings relative to sales and costs. |
| Liquidity | Can we pay our bills today? | Maintain enough cash to cover short-term obligations. |
| Solvency | Can we survive in the long run? | Balance debt and equity for long-term stability. |
| Efficiency | How well are we using our stuff? | Optimize the use of assets and inventory. |
| Valuation | What is the company worth? | Determine the fair market value for investors. |
Understanding these categories helps you avoid the “single metric trap.” For example, a company might be highly profitable (Profitability) but have all its cash tied up in unpaid invoices (Liquidity), leading to a sudden collapse. You need a balanced view to assess a company’s financial health accurately.
13 Essential Financial Performance Measures to Track

Whether you are a seasoned executive or a manager without a finance background, these 13 financial performance measures are the ones you should keep on your weekly or monthly dashboard.
1. Gross Profit Margin
Formula: (Revenue – COGS) / Revenue
This measures the percentage of revenue left after subtracting the direct costs of producing your goods or services (Cost of Goods Sold, or COGS). For SaaS businesses, a healthy gross margin typically ranges from 70% to 85%. If this number is dropping, your production costs are rising faster than your prices—a recipe for trouble.
2. Net Profit Margin
Formula: Net Income / Revenue
This is the “bottom line.” It accounts for everything: COGS, operating expenses, interest, and taxes. While a margin of 100% (or 1.0) would mean you have zero expenses (impossible in the real world!), a healthy range for most industries is above 10%. It tells us how much of every dollar earned actually stays in our pockets.
3. Working Capital
Formula: Current Assets – Current Liabilities
Working capital represents your operating liquidity. It’s the “cushion” you have for day-to-day operations. If your current liabilities exceed your assets, you may struggle to pay employees or suppliers, even if you have millions in future contracts.
4. Current Ratio
Formula: Current Assets / Current Liabilities
This is a standard liquidity test. We generally look for a ratio greater than 1.0. A ratio of 2.0 means you have twice as many assets as debts due within the year, providing a comfortable financial safety net.
5. Quick Ratio (Acid-Test)
Formula: (Current Assets – Inventory) / Current Liabilities
The Quick Ratio is a more conservative version of the Current Ratio. It excludes inventory because, let’s be honest, you can’t always sell your stock overnight to pay a debt. A quick ratio lower than 1.0 is often a warning sign that a company is “asset rich but cash poor.”
6. Leverage
Formula: Total Assets / Total Equity
Also known as the equity multiplier, this measures how much of your company is financed by debt versus equity. High leverage can amplify returns during good times, but it increases risk during downturns.
7. Debt-to-Equity Ratio
Formula: Total Liabilities / Shareholder Equity
This helps us understand the capital structure. Latios vary by industry, but lenders often look at this to see if you can handle more loans. In Minnesota, banks might use this as a “covenant”—if your ratio gets too high, they might call in your loan.
8. Inventory Turnover
Formula: COGS / Average Inventory
How many times did you sell and replace your stock this year? High turnover means you’re efficient; low turnover suggests you have “dead stock” sitting in a warehouse in Minneapolis gathering dust.
9. Total Asset Turnover
Formula: Revenue / Total Assets
This measures efficiency. For every dollar of assets we own (computers, buildings, software), how much revenue are we generating? It’s a great way to see if management is actually putting resources to work.
10. Return on Equity (ROE)
Formula: Net Income / Shareholder Equity
This is the ultimate measure of shareholder value. It tells investors how much profit the company generates with the money they’ve put in. If ROE is 15%, the company earned 15 cents for every dollar of equity.
11. Return on Assets (ROA)
Formula: Net Income / Total Assets
ROA tells us how profitable a company is relative to its total resources. It’s a clean way to compare management efficiency across different companies, regardless of how they are financed.
12. Operating Cash Flow
Formula: Net Income + Non-cash Expenses – Increase in Working Capital
Cash is king. Operating cash flow measures the cash generated from core business activities. You can use direct or indirect methods to calculate this, but the goal is the same: ensure you have actual greenbacks to grow the business.
13. Seasonality
While not a single formula, seasonality is a critical metric to monitor. It involves analyzing periodic fluctuations in your performance. If your sales always dip in the Minnesota winter, you need to know that so you don’t panic when the January reports come in.

Advanced Financial Metrics for Tech and SaaS Growth

For growth-stage tech companies, traditional metrics don’t always tell the full story. If we are spending heavily on marketing to acquire customers who will pay us for the next ten years, our current “Net Profit” might look terrible, even if the business is actually a gold mine.
This is why we track specific performance metrics for SaaS:
- Annual Recurring Revenue (ARR): The total predictable revenue you expect every year.
- Customer Acquisition Cost (CAC): How much you spend in sales and marketing to get one new customer.
- Lifetime Value (LTV): The total revenue you expect to earn from a customer over their entire relationship with you.
- Net Dollar Retention (NDR): This measures how much your revenue grows from existing customers (after churn). Top-performing tech companies maintain NDR above 120%.
Benchmarking Growth-Stage Financial Metrics
To know if your growth is “healthy,” we use several key benchmarks:
- The Rule of 40: This states that your revenue growth rate plus your EBITDA profit margin should equal or exceed 40%. For example, if you are growing at 60% but have a -15% profit margin, your score is 45%—you pass!
- LTV:CAC Ratio: A healthy ratio is typically 3:1 or higher. If it’s 1:1, you are spending everything you earn just to get the customer.
- CAC Payback Period: How many months does it take to earn back the cost of acquiring a customer? For tech companies, 16 months or less is the gold standard.
How to Monitor and Visualize Financial Metrics for Strategic Planning
Tracking these metrics shouldn’t be a once-a-year event during tax season. Modern finance teams use real-time dashboards and ERP (Enterprise Resource Planning) integration to keep these numbers front and center.
At Demandflow, we believe in “structured growth architecture.” This means your financial data should flow automatically into a dashboard where you can see trends as they happen. Monthly metric reviews with your leadership team and board ensure everyone is aligned on the “North Star” goals.
For those looking to dive deeper into the mechanics, we recommend checking out A Manager’s Guide to Finance & Accounting.
The Role of a Chart of Accounts in Tracking Financial Metrics
You can’t track what you haven’t organized. Your Chart of Accounts (COA) is the foundational structure of your entire financial system. It’s a categorized list of every place your money goes.
For a SaaS company, a well-organized COA separates “Cost of Revenue” from “Operating Expenses.” Without this clarity, your Gross Margin calculations will be wrong, leading to bad strategic decisions. Think of your COA as the filing cabinet for your business—if the files are messy, you’ll never find the truth.
Frequently Asked Questions about Financial Performance
What are the top 3 financial metrics every company should track?
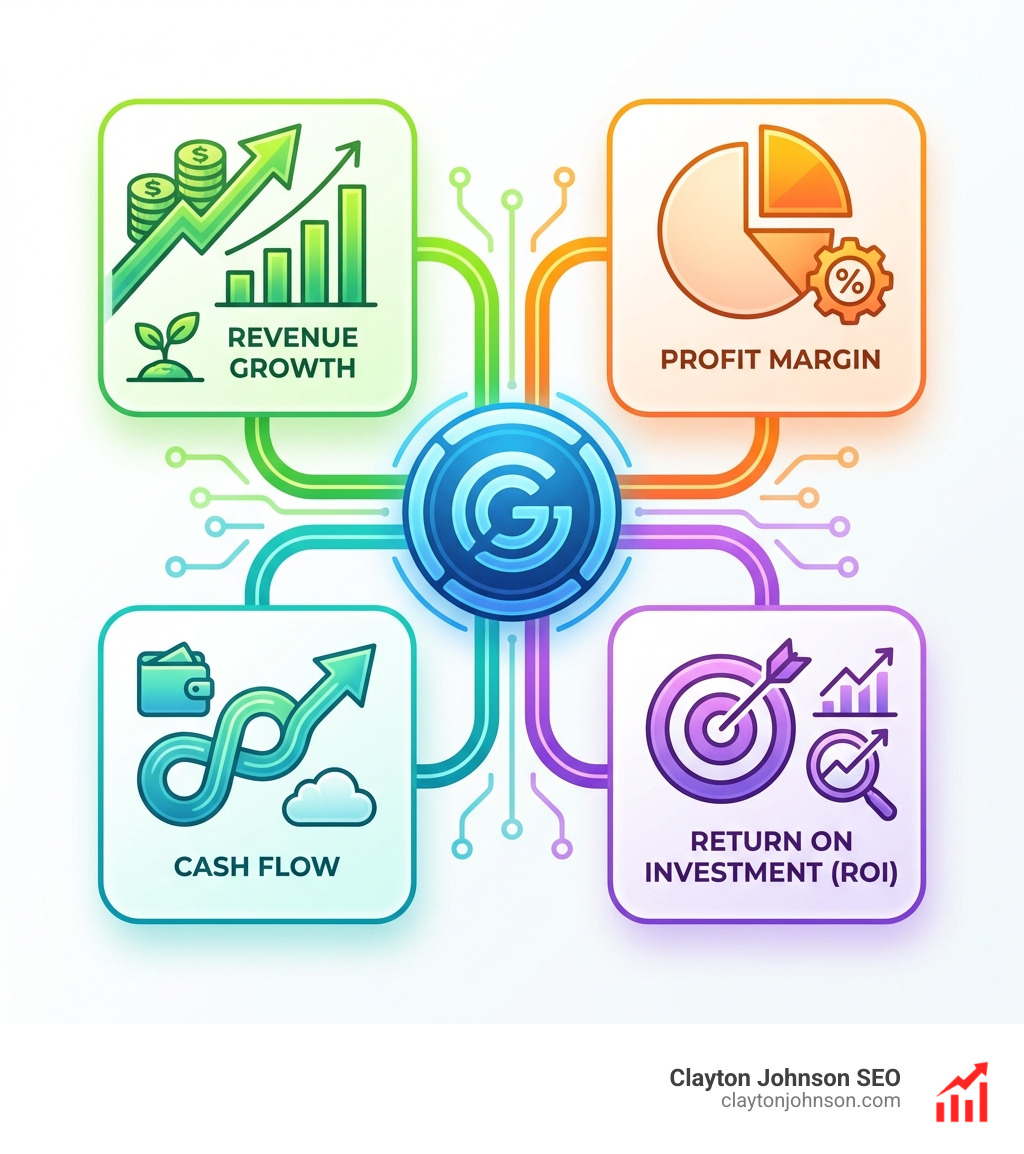
While every business is unique, the “Big Three” are generally Revenue (top line), Net Profit (bottom line), and Operating Cash Flow (actual cash). For startups, Burn Rate (how fast you are spending cash) often replaces Net Profit as a top priority.
What is a healthy gross margin for a SaaS business?
In the tech world, we look for gross margins between 70% and 85%. Because the “cost” of delivering software to one more user is very low, most of your revenue should be available to reinvest in marketing and R&D.
How do you calculate the Rule of 40?
It’s simple: Growth Rate + Profit Margin. If your year-over-year revenue growth is 30% and your EBITDA margin is 15%, your score is 45. Anything 40 or above is considered “elite” growth.
Conclusion
Mastering Financial Metrics is not about becoming an accountant; it’s about becoming a better leader. When you understand the relationship between your activities and your numbers, you gain the leverage needed for compounding growth.
Strategic alignment happens when your team knows exactly which levers to pull to improve the Current Ratio or boost ROE. This clarity creates a competitive advantage that “gut-feeling” competitors simply can’t match.
At Clayton Johnson and Demandflow.ai, we help founders and marketing leaders build this structured growth architecture. We move beyond simple tactics to create systems where clarity leads to structure, and structure leads to leverage.
Ready to stop guessing and start growing? Master your growth architecture with our guide to Financial Metrics.