Visualizing Your Competitive Edge with a Strategy Canvas
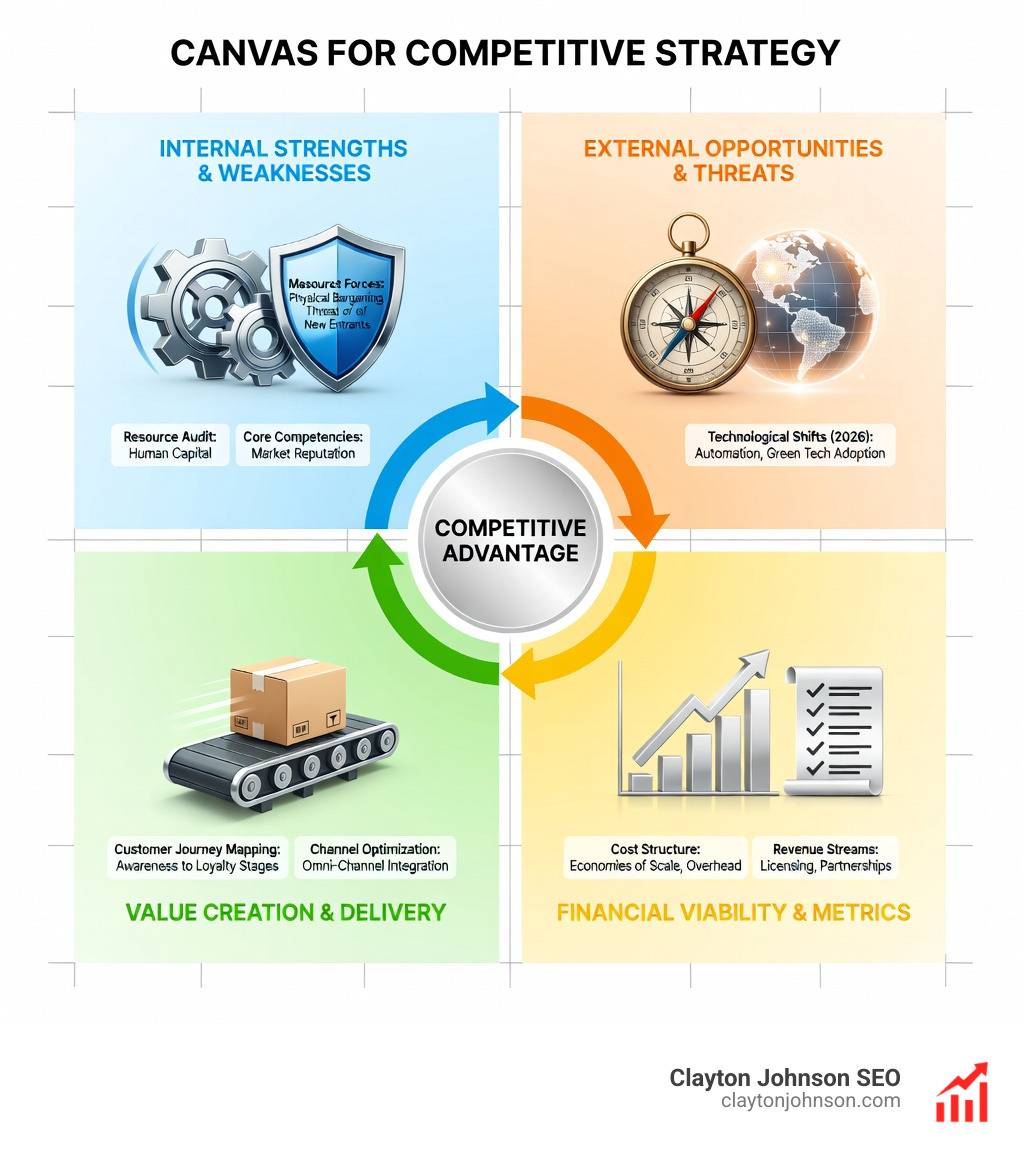
Canvas for competitive strategy is a one-page visual tool that maps how your business compares to competitors across the factors customers actually care about. It helps you see where you’re over-investing, where you’re falling short, and where white space opportunities exist.
Quick Answer: What is a Canvas for Competitive Strategy?
| Element | Description |
|---|---|
| What it is | A visual analytic tool that plots your offering against competitors on key buying factors |
| Who created it | W. Chan Kim and Renée Mauborgne (Blue Ocean Strategy) |
| Key components | Horizontal axis (competing factors), vertical axis (offering level), value curves (strategic profiles) |
| Primary purpose | Identify differentiation opportunities and blue ocean market space |
| Best for | Diagnosing current positioning and diagnosing future competitive strategy |
Most companies define competition too narrowly. They benchmark against direct rivals on obvious factors like price and features, creating what Blue Ocean Strategy calls a “red ocean”—bloody waters where everyone fights for the same customers.
The strategy canvas forces a different view. It visualizes the full competitive landscape, including substitute products and non-customers. More importantly, it reveals which factors you can eliminate, reduce, raise, or create to break free from head-to-head competition.
Research shows that 75–90% of strategies fail at execution. One reason? Teams lack a shared picture of where they stand and where they’re going. A strategy canvas provides that clarity in a single visual snapshot.
The tool works equally well for diagnostics (understanding your current position) and design (crafting a differentiated future). Southwest Airlines used it to compete against both traditional airlines and car travel. [yellow tail] wine used it to create an entirely new “casual wine” category. Harley-Davidson discovered that emotional and social factors—not functional specs—drove their competitive edge.
I’m Clayton Johnson, and I’ve spent years building competitive positioning frameworks that help businesses identify strategic opportunities through tools like the Canvas for competitive strategy. My work focuses on turning fragmented market insights into structured visual systems that drive measurable differentiation.

Important Canvas for competitive strategy terms:
What is a Strategy Canvas for Competitive Strategy?
A Canvas for competitive strategy is more than just a graph; it is a central diagnostic tool and an action framework for building a compelling blue ocean strategy. It graphically captures the current strategic landscape and your future prospects in one simple picture. By plotting the level of investment an organization makes in specific competitive factors, it reveals the “strategic profile” or value curve of a company.
When we look at a canvas, we aren’t just looking at data points. We are looking at a story. It tells us which factors the industry currently competes on and where the “herd” is moving. If your value curve looks exactly like your competitors’, you are stuck in a red ocean. To win, your curve must diverge.
Strategy Canvas vs. Business Model Canvas
It is common to confuse the Strategy Canvas with the Business Model Canvas official template. While both are powerful, they serve different masters:
- Strategy Canvas: Focuses on external positioning. It asks, “How do we look to the buyer compared to everyone else?” It maps value curves and identifies market white space.
- Business Model Canvas: Focuses on internal infrastructure and the mechanics of value delivery. It covers nine building blocks like key partners, revenue streams, and cost structures.
In short, the Strategy Canvas helps you decide what to offer to beat the competition, while the Business Model Canvas helps you figure out how to build the business to deliver that offer.
The Origin and Purpose of the Strategy Canvas
The Strategy Canvas was developed by Chan Kim and Renée Mauborgne, professors of strategy at INSEAD and co-directors of the Blue Ocean Strategy Institute. They first introduced it in their seminal book, Blue Ocean Strategy: How To Create Uncontested Market Space And Make The Competition Irrelevant.
The purpose of the canvas is to break the value-cost trade-off. Traditional strategy suggests you can either create greater value for customers at a higher cost or create reasonable value at a lower cost. Kim and Mauborgne argued that by using the canvas as a diagnostic tool, companies can achieve differentiation and low cost simultaneously by eliminating factors that don’t add value and creating new ones that do.

Anatomy of the Strategy Canvas: Axes and Value Curves
To build a Canvas for competitive strategy, you need to understand its two primary dimensions:
- The Horizontal Axis: This lists the range of factors the industry competes on and invests in. These are the “rules of the game” for your sector.
- The Vertical Axis: This represents the offering level that buyers receive across all these key competing factors. A high score means a company invests more and offers more to the buyer in that specific factor.
When you connect the dots across these factors, you get the Value Curve. This is the heart of the canvas. It is a graphic depiction of a company’s relative performance across its industry’s factors of competition.
Identifying Factors for a Canvas for Competitive Strategy
Identifying the right factors is where most teams struggle. You shouldn’t just list what you think is important; you must list what the customer values. This requires a deep dive into market analysis and SWOT.
Ask yourself:
- What are the standard industry benchmarks?
- What are the hidden pain points customers complain about in reviews?
- Why do “non-customers” refuse to buy from this industry altogether?
As noted in the Harvard Business Review article on charting your future, many executives are “paralyzed by the muddle” of traditional planning. Identifying these factors clarifies the muddle by forcing you to choose what actually moves the needle for the buyer.
| Factor Type | High-Investment Logic | Low-Investment Logic |
|---|---|---|
| Price | High Price (Premium) | Low Price (Economy) |
| Service | High Touch/Personal | Self-Service/Automated |
| Variety | Massive Selection | Niche/Curated |
| Speed | Instant Delivery | Standard Lead Times |
Scoring and Plotting Your Competitors
Once you have your factors, it’s time to score. We recommend using a simple 0–10 scale. This isn’t meant to be a perfect scientific measurement; it’s a relative scale to help you think about competitive pressure visually.
Don’t just look at direct rivals. Look at substitute products. For an airline, a substitute might be a high-speed train or even a car. If you only plot other airlines, you miss the bigger picture of why people choose to travel the way they do.
Step-by-Step Guide to Building Your Strategy Canvas
Building a canvas is a collaborative process. We’ve found that the best strategies are done by the team, not to them. Follow these steps to master the process:
- Identify the Competition: Look through the customer’s eyes. Who else are they “hiring” to do this job?
- Identify the Factors of Competition: Brainstorm with stakeholders. Use 7 steps to master competitor analysis to ensure you don’t miss non-traditional factors.
- Evaluate and Plot (Visual Awakening): Rate yourself and your competitors. This often reveals a “Visual Awakening”—the realization that your strategy is either a “me-too” copy or a confusing mess.
- Fieldwork (Visual Exploration): Go outside. Talk to customers and, more importantly, non-customers. Find out why people are moving away from the industry standard.
- Develop New Strategy (Visual Strategy Fair): Use the Four Actions Framework to draw “to-be” canvases.
- Visual Communication: Distribute your before-and-after canvas to the whole company. If a project doesn’t support the new value curve, don’t fund it.

Applying the Four Actions Framework (ERRC)
The Four Actions Framework is the engine that drives the Blue Ocean Strategy Canvas tools. To break the value-cost trade-off, you must ask:
- Eliminate: Which factors that the industry takes for granted should be eliminated? (e.g., Airplane meals).
- Reduce: Which factors should be reduced well below the industry standard? (e.g., Seat choices).
- Raise: Which factors should be raised well above the industry standard? (e.g., Friendly service).
- Create: Which factors should be created that the industry has never offered? (e.g., High departure frequency).
By eliminating and reducing, you drop your cost structure. By raising and creating, you lift your value proposition.
Using a Canvas for Competitive Strategy in Tech and Digital Markets
In the tech world, “feature bloat” is a common red ocean trap. Companies keep adding features until the product is too complex to use. A Canvas for competitive strategy helps tech founders focus on what matters.
Are you aiming for product leadership, operational excellence, or customer intimacy? If you’re building a tech startup template for scalable growth, your canvas might focus on user experience (UX) and integration speed rather than a laundry list of features. Digital innovation via the Business Model Canvas often starts with a strategy canvas to identify which digital “jobs” are currently underserved by legacy players.
Real-World Examples of Strategic Differentiation
Let’s look at how these theories play out in the real world. These examples are classic for a reason—they demonstrate the power of a divergent value curve.
- Southwest Airlines: They didn’t just compete with United or American. They competed with the car. By eliminating meals, hubs, and seat assignments (Eliminate/Reduce) and raising departure frequency and friendly service (Raise/Create), they created a value curve that looked more like a “bus in the sky” than a traditional airline.
- [yellow tail] wine: They realized the wine industry was too focused on prestige, aging, and complex descriptions. They eliminated all of that. They created a wine that was “fun,” easy to select, and sweet enough for non-wine drinkers. They didn’t just win a share of the wine market; they grew the entire market.
- Harley-Davidson: While Honda and Yamaha focused on functional specs like speed and fuel efficiency, Harley-Davidson focused on the engine sound, the brand community, and the “outlaw” image. Their strategy canvas shows they are “low” on many functional factors but “off the charts” on emotional and social factors.
Lessons from Southwest Airlines and [yellow tail]
The biggest lesson here is focus. You cannot be everything to everyone. Southwest chose to be the most frequent and friendly, but they gave up the “luxury” factors to get there. [yellow tail] chose to be approachable, giving up the “connoisseur” factors.
When you are mastering BMC channels and relationships, your strategy canvas tells your marketing team exactly what to talk about. You don’t market your “average” features; you market your “divergent” ones.

Integrating the Canvas with Other Strategic Frameworks
The Strategy Canvas doesn’t exist in a vacuum. To get a 360-degree view of your market, we often integrate it with other tools from our box of other strategy tools.
- Porter’s Five Forces: Use Porter’s Five Forces to understand the structural attractiveness of the industry before you try to change it.
- PESTLE Analysis: Use PESTLE analysis to identify macro-trends (like new regulations or tech shifts) that might create new factors you can “Create” on your canvas.
- SWOT Integration: A guide to BMC and SWOT integration helps you see if you actually have the internal strengths to pull off the “Create” and “Raise” actions on your strategy canvas.
By combining these, you ensure your “Blue Ocean” isn’t just a fantasy, but a sustainable competitive advantage rooted in reality.
Frequently Asked Questions about Strategy Canvases
How do you identify the right factors of competition?
Look at the “Jobs to be Done.” What is the customer actually trying to achieve? If they are buying a drill, the factor isn’t “drill speed,” it’s “hole quality.” Talk to people who stopped using your product. Their reasons for leaving often point to the factors the industry is over-valuing or under-delivering.
What are the most common mistakes when building a canvas?
The most common mistake is being too internal. Teams often score themselves higher than customers would. Another mistake is including too many factors (20+). Keep it to the 5–10 factors that actually drive the buying decision. Finally, don’t forget price—it’s almost always a key factor on the horizontal axis.
Can a strategy canvas be used for personal branding or small businesses?
Absolutely. If you are a freelance consultant in Minneapolis, your factors might be “response time,” “niche expertise,” “price,” and “reporting depth.” If every other consultant is high on price and low on reporting, you can differentiate by creating a “real-time dashboard” factor that no one else offers.
Conclusion
Strategy is about making choices. The Canvas for competitive strategy is the best tool we have to visualize those choices and ensure they lead to a unique market position. Whether you are a startup in Minnesota or a global enterprise, the clarity provided by a single-page value curve is invaluable.
At Clayton Johnson SEO, we believe that great marketing starts with a great strategy. If your “value curve” is a carbon copy of your competitors’, no amount of SEO or ad spend will create sustainable growth. You need a competitive edge that is visible, defensible, and customer-centric.
Ready to find your blue ocean? We help founders and marketing leaders diagnose growth problems and build SEO content marketing services that reflect a truly differentiated strategy. Let’s stop fighting in the red ocean and start building your competitive edge.