12 Demand Generation Metrics for Sales Funnel Health
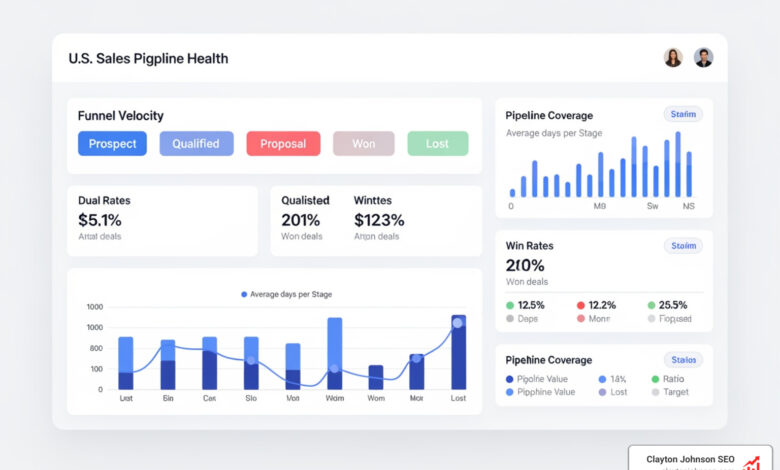
Why Sales Pipeline Health Metrics Determine Whether You Hit Revenue Targets
Sales pipeline health metrics are the measurable data points that tell you whether your deals are moving, stalling, or dying — before it’s too late to do anything about it.
Here are the core metrics to track:
| Metric | What It Measures |
|---|---|
| Pipeline Velocity | How fast revenue moves through your pipeline |
| Pipeline Coverage Ratio | Total pipeline value vs. your revenue target (aim for 3x-6x) |
| Win Rate | % of qualified opportunities that close (benchmark: 50%+) |
| Stage Conversion Rate | % of deals advancing from one stage to the next |
| Deal Aging / Stall Rate | Deals stuck longer than 1.5x the average stage duration |
| MQL to SQL Conversion | How well marketing leads translate to real opportunities |
| Average Deal Size | Average revenue per closed deal |
| Sales Cycle Length | Average time from first contact to close |
| Lead Velocity Rate | Growth rate of qualified leads entering your pipeline |
| LTV to CAC Ratio | Customer lifetime value vs. cost to acquire (benchmark: 3:1) |
| Opportunity-to-Close Rate | % of pipeline opportunities that become closed-won deals |
| Forecast Accuracy | How closely predicted revenue matches actual results |
Think about this scenario: a sales VP reviews dashboards showing a full, healthy pipeline. Then the quarter ends — and only half the projected revenue lands. The pipeline looked healthy. But the team was tracking the wrong things.
This is more common than it should be. Most sales organizations measure what’s easy to track — total pipeline value, number of deals, stage distribution. These describe what the pipeline looks like right now. They don’t predict what will actually close.
The metrics that actually matter are forward-looking. They show you where deals are slowing down, which leads are worth pursuing, and whether your team has enough in the pipeline to hit quota. Companies with accurate sales forecasting are 10% more likely to grow revenue year over year — and it starts with tracking the right signals.
I’m Clayton Johnson, an SEO strategist and demand generation expert who has spent nearly two decades building data-driven growth systems for B2B companies — including frameworks that connect organic search performance directly to sales pipeline health metrics and revenue outcomes. In the sections ahead, I’ll walk you through the 12 metrics that give you a true picture of pipeline health and help you forecast with confidence.

Essential sales pipeline health metrics for Revenue Prediction
To truly gauge the health of your sales pipeline, we have to look past the “vanity” numbers. Total pipeline value is often a liar; it includes “dead” deals that haven’t moved in months and optimistic “fluff” from reps trying to look busy. If 25% of your pipeline hasn’t moved stages in a month, your true coverage is probably much lower than you think.
Predicting revenue requires shifting from retrospective reporting to predictive indicators. According to Forbes, accurate forecasting is a primary driver of year-over-year growth. By zeroing in on the right metrics, you can guide your team toward sustainable success. This involves analyzing the opportunity-to-close rate, which measures the percentage of opportunities that actually become revenue.
Early-stage pipeline might only close 15% of the time, while late-stage deals might close at 70%. If you aren’t weighting these by stage, your forecast is essentially a guess. High-performing teams also prioritize lead quality over quantity. A pipeline stuffed with 500 low-quality leads is far more dangerous than one with 50 highly qualified opportunities because it wastes your most expensive resource: your sales team’s time. For teams looking to build this kind of high-intent lead flow, our B2B SEO services guide offers a roadmap for attracting the right prospects from the start.

1. Pipeline Velocity and Sales Cycle Length
If we had to pick one metric to rule them all, it would be Pipeline Velocity. It’s the speed at which money moves through your funnel.
The formula is simple but powerful: (Number of Opportunities x Average Deal Size x Win Rate %) / Sales Cycle Length
This metric is a diagnostic powerhouse. If your velocity drops, you can look at the four variables to see why. Is it taking longer to close? Are deal sizes shrinking? Or is the win rate dipping? A typical B2B sales cycle lasts a little over two months. If yours is significantly longer, it signals bottlenecks that need immediate attention.
According to McKinsey, automation across a sales organization can open up 20% more team capacity. This extra time allows reps to focus on “multi-threading” — building relationships with multiple stakeholders. We know that deals with 3+ stakeholder relationships close at 2.5x the rate of single-threaded deals. By automating follow-ups and data entry, your team can spend more time orchestrating these complex, high-value relationships.
2. Pipeline Coverage Ratio and Quota Alignment
Pipeline coverage measures how much potential revenue is sitting in your pipeline compared to your revenue targets. You can’t just have 1:1 coverage; you need a “cushion” to account for the deals you will inevitably lose.
A common benchmark is maintaining anywhere from three to six times your quota in pipeline value. However, the “right” ratio depends on your sales motion:
- Enterprise (Long cycles): 3x-4x coverage.
- Mid-market (Medium cycles): 3x-5x coverage.
- SMB / Velocity (Short cycles): 4x-6x coverage.
If your coverage falls below 3x at any point, it’s a massive red flag. If it hits 2x with more than 30 days left in the quarter, you need an emergency intervention. To prevent these gaps, we recommend a B2B demand gen audit to ensure your top-of-funnel activities are consistently feeding the machine.
3. Analyzing Win Rates as sales pipeline health metrics
Win rate is the ultimate “truth-teller” in sales. It’s the percentage of opportunities that ultimately become closed-won deals. While industry averages vary, a good win rate is generally considered anything above 50% for qualified opportunities.
If your win rate starts to dip, it’s rarely a “closing” problem. Usually, it’s a qualification problem. Are you letting low-quality leads into the pipeline just to hit a “total value” number? This creates a “bloated” pipeline that looks great on a Tuesday morning meeting but fails to deliver on the last day of the month.
By analyzing win rates by rep and by stage, you can identify coaching opportunities. For instance, if a rep has a high conversion rate from “Discovery” to “Proposal” but a low win rate at “Closing,” they might need help with negotiation or objection handling. We focus on building demand generation systems that prioritize high-intent leads to keep these win rates naturally high.

Optimizing sales pipeline health metrics to Eliminate Bottlenecks
A healthy pipeline should look like a funnel — wide at the top and narrow at the bottom. But often, it looks like a “clogged pipe” where deals get stuck in the middle. We call this stagnation.
A key indicator of a bottleneck is Stage Duration. If a deal stays in a single stage for more than 1.5x the average duration, it is “stalled.” If more than 20% of your pipeline is stalled, your reported pipeline size is inflated and your forecast is officially unreliable.
| Metric Segment | Enterprise Sales | SMB Sales |
|---|---|---|
| Pipeline Coverage | 3x – 4x | 4x – 6x |
| Sales Cycle | 6 – 12 Months | 1 – 3 Months |
| Stakeholder Depth | 3+ Contacts Required | 1 – 2 Contacts |
| Win Rate Target | 20% – 35% | 40% – 60% |
One of the most effective ways to break these bottlenecks is “multi-threading.” Research from Gong shows that single-threaded deals (where you only talk to one person) close at significantly lower rates. In enterprise sales, deals with multiple stakeholders close at 2.5x the rate of single-threaded ones. If your reps are only talking to one person, that deal is at high risk of stalling the moment that person goes on vacation or changes jobs.
4. Tracking Deal Aging within sales pipeline health metrics
Deal Age is a silent revenue killer. The longer a deal sits in your pipeline, the less likely it is to close. We call this “deal rot.”
To maintain healthy sales pipeline health metrics, you must run a weekly deal aging report. Any deal that has exceeded 2x the average stage duration should be re-qualified or removed entirely. Removing these “stalled” deals typically clears out 20-30% of your inflated pipeline. While it might hurt to see the total value drop, your forecast accuracy will skyrocket.

Cleaning up a bloated pipeline is uncomfortable, but the truth works for you, not against you. It allows you to see the “real” gaps in your revenue so you can spend more time on SEO-driven B2B funnels that bring in fresh, active prospects.
5. MQL to SQL Conversion and Lead Velocity
The handoff between marketing and sales is where most pipelines fail. If your Marketing Qualified Leads (MQLs) aren’t converting into Sales Qualified Leads (SQLs), you have a “signal vs. noise” problem.
A big drop-off here usually means marketing and sales aren’t aligned on what a “good” lead looks like. We use lead scoring to automatically prune less promising prospects before they ever reach a rep. This ensures your sales team is only working on high-priority opportunities.
To keep the pipeline growing, we track Lead Velocity Rate (LVR) — the month-over-month growth in qualified leads. LVR is a leading indicator of future revenue. If your LVR is growing, your revenue will likely follow in the coming months. If you’re seeing a gap here, it’s time for a B2B SEO audit to identify where your traffic systems are failing to capture intent.
6. LTV to CAC Ratio and Unit Economics
Finally, we have to look at the “unit economics” of your pipeline. It’s not just about closing deals; it’s about closing profitable deals.
The LTV to CAC ratio measures the Lifetime Value of a customer against the Cost to Acquire them.
- The Industry Standard: 3:1.
- The Danger Zone: 1:1 (You are essentially spending $1 to make $1).
- The Growth Zone: 5:1 (You have an incredibly efficient engine and should spend more on marketing).
At Clayton Johnson SEO, we build demand generation systems that focus on lowering CAC through organic authority while increasing LTV by attracting customers whose needs perfectly align with your product.

Summary: Keeping Your Pipeline in Check
Maintaining healthy sales pipeline health metrics isn’t a “once a quarter” task. It’s a weekly discipline.
- Weekly: Review leading indicators like Pipeline Velocity, Coverage Ratio, and Stall Rate.
- Monthly: Analyze Stage Conversion Rates and trend comparisons.
- Quarterly: Review Win Rate by source and segment to adjust your long-term strategy.
A healthy pipeline is more than just a list of names in a CRM. It’s a moving, breathing reflection of your business’s future. By tracking these 12 metrics, you move from guessing to knowing — and that is how you build a scalable, predictable revenue engine.