Why ROI Marketing Frameworks for B2B Are Hard to Get Right
ROI marketing frameworks for B2B give you a structured system to measure whether your marketing spend is actually generating revenue — not just traffic or leads.
Here’s a quick-reference breakdown of what a B2B marketing ROI framework covers:
| Component | What It Measures |
|---|---|
| ROI Formula | (Revenue from Marketing – Investment) / Investment x 100 |
| Attribution Model | Which channels and touchpoints get credit for revenue |
| Leading Indicators | MQLs, SQLs, Pipeline Velocity |
| Lagging Indicators | CAC, LTV, Closed Revenue |
| Benchmark Target | 5:1 revenue-to-spend ratio (industry standard) |
B2B marketing is fundamentally different from B2C. Deals take months — sometimes over a year — to close. Multiple decision-makers are involved. A single sale can touch dozens of channels before it converts.
That complexity makes ROI hard to pin down.
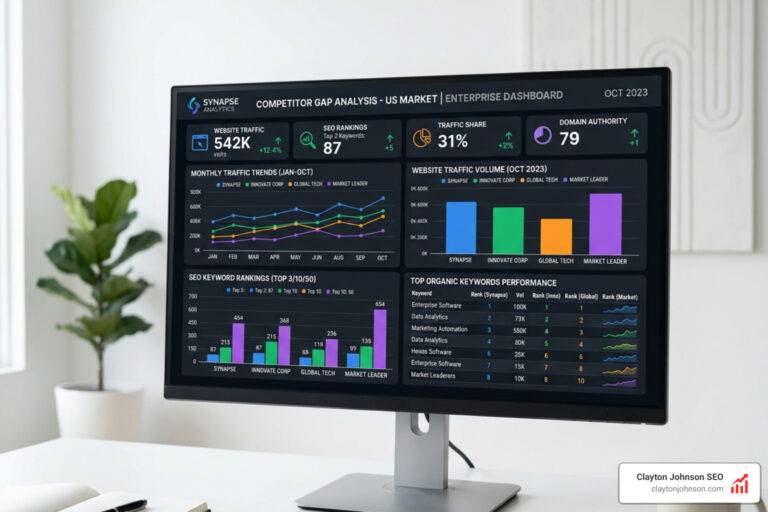
Most B2B teams end up measuring the wrong things — page views, MQL volume, click-through rates — metrics that feel good but don’t connect to actual revenue. As one common pattern shows, a blog post with 50,000 views can generate zero demos, while a post with 500 views drives three qualified conversations.
The gap between marketing activity and marketing impact is where most budgets get wasted.
A proper ROI framework closes that gap. It connects your spend to your pipeline, your pipeline to closed revenue, and your revenue to long-term customer value.
I’m Clayton Johnson, an SEO strategist and demand generation expert who has spent nearly two decades building data-driven frameworks that connect marketing investment to measurable business growth — including roi marketing frameworks for b2b that scale. In this guide, I’ll walk you through exactly how to build and implement one.

Core Components of ROI Marketing Frameworks for B2B
To build a system that the C-suite actually trusts, we have to move past “marketing fluff” and into “financial math.” An effective framework isn’t just a dashboard; it’s a set of rules for how we allocate capital.
The first step is understanding that B2B buyers don’t follow a straight line. Research from Think with Google shows that eight out of ten online purchases involve multiple interactions. In high-ACV (Average Contract Value) SaaS or enterprise deals, that path is even more tangled, often involving 6 to 10 buying committee members and 20 or more touchpoints.
To manage this, we use attribution models to distribute credit across the journey.
| Attribution Model | Best Use Case | Pros | Cons |
|---|---|---|---|
| First-Touch | Demand Generation | Great for seeing what sparks awareness | Ignores everything that actually closed the deal |
| Last-Touch | Sales Alignment | Simple to track in basic CRMs | Systematically undervalues top-of-funnel content |
| U-Shaped | Multi-Channel | Weights the first and last touch (40% each) | Can miss the “middle” nurturing influence |
| W-Shaped | Complex Cycles | Weights First, Lead Creation, and Opportunity (30% each) | Requires advanced tracking infrastructure |
Beyond attribution, we must align our market analysis with our Ideal Customer Profile (ICP). If your marketing is driving a high ROI on paper but the customers have a low Lifetime Value (LTV), your framework is lying to you. True ROI requires a tight feedback loop between sales and marketing to ensure we are attracting high-value accounts, not just high-volume leads.
Finally, we look for incrementality. This is the “gold standard” of measurement. It asks: “Would this deal have happened if we hadn’t run this ad?” According to Google’s modern measurement framework, incrementality testing is essential for proving causality. It moves us from seeing correlations to proving that marketing actually drove the lift.
Defining the ROI Marketing Frameworks for B2B Formula
At its heart, the ROI formula is simple, but the data going into it is often messy. We define it as:
ROI = (Net Profit – Marketing Investment) / Marketing Investment x 100
To get this right, we have to be honest about “Investment.” It’s not just your ad spend. It’s the cost of your software (HubSpot, Salesforce), your internal team’s time, freelancer fees, and distribution costs.
We also have to account for Gross Margin. If you sell a $100,000 contract but it costs you $40,000 to deliver the service, your ROI calculation should be based on the $60,000 margin.
Different channels have vastly different benchmarks. For instance, research on email marketing ROI shows that it can drive a $36 return for every dollar spent. Meanwhile, SEO is a compounding asset. While paid ads have linear returns (stop spending, stop getting leads), content and SEO provide an “844% ROI over three years” because the assets keep working long after they are published.
Aligning Attribution to ROI Marketing Frameworks for B2B
If we only look at the last thing a customer clicked before they bought, we’ll probably end up putting all our money into “branded search” ads and none into the content that actually educated the buyer.
In a modern demand generation framework, we use multi-touch attribution to see the full picture. We want to know:
- Which blog post first introduced them to our brand?
- Which webinar convinced them we were experts?
- Which case study gave them the “social proof” to request a demo?
By integrating your marketing tools directly with your CRM, you can track a prospect from their first anonymous website visit to the moment the deal is marked “Closed-Won.” This is called “closed-loop reporting,” and it is the only way to prove that marketing is a profit center, not a cost center.
Tracking Leading vs. Lagging Indicators
We can’t wait 12 months for a deal to close to know if our marketing is working. We need “leading indicators” to tell us we’re on the right track.
- Leading Indicators (Early Signals): MQLs (Marketing Qualified Leads), SQLs (Sales Qualified Leads), and Pipeline Velocity. If your MQL-to-SQL conversion rate is between 30% and 50%, you’re in a healthy spot.
- Lagging Indicators (The Ground Truth): CAC (Customer Acquisition Cost) and LTV (Customer Lifetime Value).
We use these to calculate the LTV:CAC ratio. A healthy B2B SaaS business typically aims for a 3:1 ratio or higher. If your ratio is 5:1 or 7:1, you might actually be under-investing and leaving money on the table. We also focus on conversion optimization to ensure that every dollar we spend on traffic isn’t being wasted on a leaky bucket of a website.

Implementing and Scaling Your B2B ROI System
Building roi marketing frameworks for b2b is a journey of instrumentation. You have to “instrument everything” before you can measure anything.
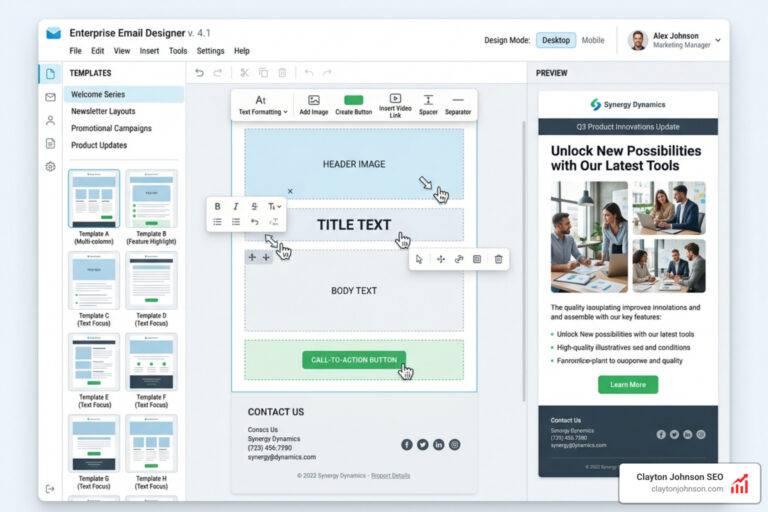
At Clayton Johnson SEO, we focus on building durable systems rather than chasing temporary tactics. This starts with master-level UTM parameters. Every link you share — in an email, on LinkedIn, or in a guest post — must be tagged so your CRM knows exactly where that lead came from.
We also leverage emerging trends like AI and ABX (Account-Based Experience). AI tools are now streamlining personalization at scale, allowing us to treat a thousand prospects like they are the only person in the room. This isn’t just about efficiency; it’s about increasing the relevance of your messaging, which directly lowers your Cost Per Acquisition (CPA).
For more on how we structure these systems, check out our strategic frameworks library.
The 3×10 Framework for Compounding Returns
One of the most powerful tools in our arsenal is the 3×10 Framework. Most marketers think they need to “10x” their results to see a massive impact. In reality, you just need to fix the “leaks” in your pipeline.
The 3×10 Framework focuses on three compounded 10% operational improvements:
- Increase Demos by 10%: Better CTAs and landing page flow.
- Increase Average Contract Value (ACV) by 10%: Better targeting of high-value ICPs.
- Lower Cost Per Acquisition (CPA) by 10%: More efficient ad spend and better SEO.
Because these numbers compound, a 10% lift in each area results in an 89% total lift in performance. This is the Pareto Principle (the 80/20 rule) in action — focusing on the 20% of activities that drive 80% of the revenue. It’s about compounding growth architecture rather than “random acts of marketing.”
Essential Tools for Data Instrumentation
You can’t manage what you can’t measure. To run roi marketing frameworks for b2b, you need a unified tech stack that talks to itself.
- CRM (The Source of Truth): Salesforce or HubSpot. This is where your revenue data lives.
- Marketing Automation: HubSpot or Marketo. This tracks the “middle” of the funnel.
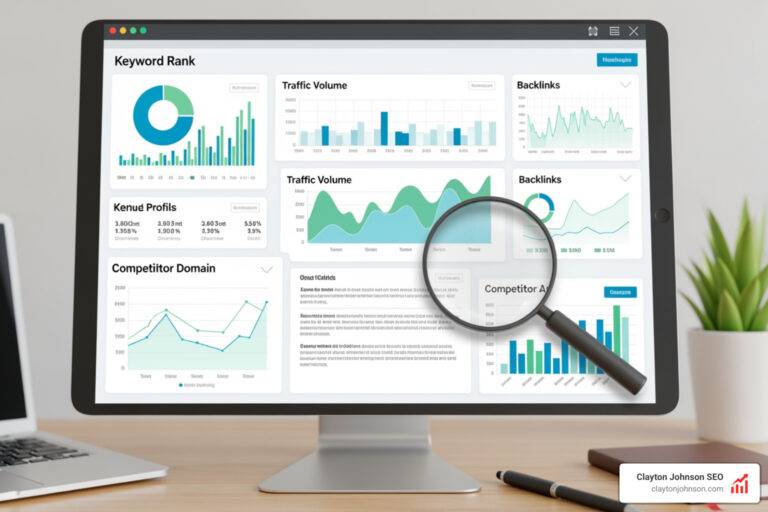
- Attribution & Analytics: HockeyStack, Dreamdata, or GA4. These tools “stitch” the journey together across different devices and sessions.
- SEO & Intent Tools: Ahrefs, SEMrush, or Demandbase for tracking who is researching your solution before they ever fill out a form.
Optimizing the LTV:CAC Ratio
The final boss of B2B marketing is the LTV:CAC ratio. If your CAC is $10,000 and your LTV is $30,000, you have a 3:1 ratio. You are profitable.
But ROI isn’t just about acquisition. It’s also about expansion and retention. It is significantly cheaper to keep a customer than to find a new one. By using SEO-driven B2B funnels, we can nurture existing customers with helpful content that drives cross-selling and upselling opportunities.
We also monitor the Payback Period. This is the number of months it takes to “earn back” the cost of acquiring a customer. For a venture-backed SaaS company, we want to see this under 12 months. If it takes 24 months to break even on a customer, your cash flow will be strained, even if your ROI looks good on paper.
Common Mistakes to Avoid
Even with the best roi marketing frameworks for b2b, teams often stumble. Here are the “ROI killers” we see most often:
- Measuring Too Early: Content marketing and SEO take time to compound. If you kill a program at month three because the ROI isn’t positive yet, you’re stopping right before the “hockey stick” growth kicks in.
- Ignoring Assisted Conversions: Just because someone clicked a “branded ad” last doesn’t mean that ad did all the work. They likely read five of your blog posts first.
- Data Silos: If your marketing data lives in one spreadsheet and your sales data in another, you will never have a true picture of ROI.
- Chasing Vanity Metrics: Clicks, impressions, and “likes” don’t pay the bills. If a metric doesn’t eventually lead to a dollar, it shouldn’t be a primary KPI.

Conclusion: Building Your ROI Engine
Building a scalable B2B marketing framework isn’t a one-time project; it’s an ongoing discipline. It requires a shift from “guessing” to “calculating.”
By implementing the systems we’ve discussed — from multi-touch attribution to the 3×10 Framework — you can turn your marketing department into a predictable revenue engine. You’ll gain the clarity to know exactly which channels to scale, which to cut, and how to defend your budget to the CFO with cold, hard math.
At Clayton Johnson SEO, we don’t just advise on these frameworks — we build the systems that operationalize them. We sit at the intersection of technical SEO, strategic positioning, and AI-augmented workflows to ensure your marketing isn’t just busy, but profitable.
Ready to build your own growth engine? Let’s stop chasing tactics and start building systems that compound. Reach out today to see how we can align your strategy with measurable outcomes.


")