Why 42% of Startups Fail (And How a PMF Template Fixes It)
A product market fit analysis template gives you a structured, repeatable way to test whether your product solves a real problem for a real market — before you burn through your budget finding out the hard way.
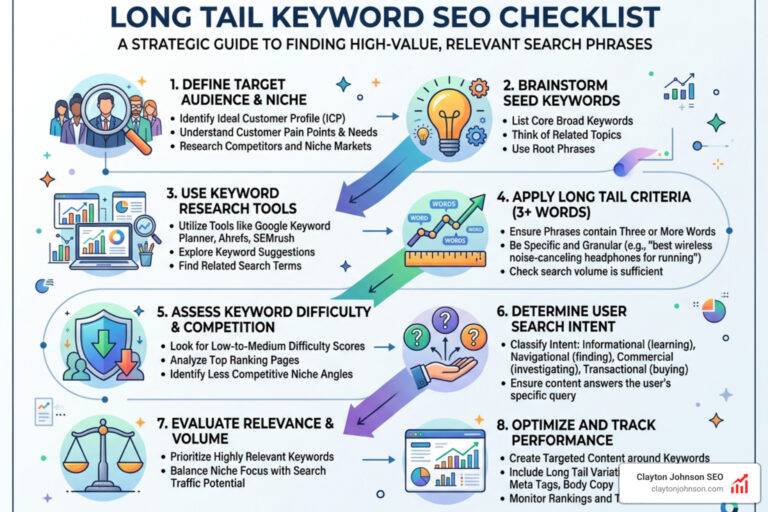
Here’s what a PMF analysis template typically includes:
- PMF Canvas – Map your target customer, their underserved needs, your value proposition, feature set, and user experience in one visual framework
- Sean Ellis Survey – Ask active users: “How would you feel if you could no longer use our product?” Target 40%+ answering “very disappointed”
- Response collection – Gather 40-100 responses from recent, active users within 5-10 days for statistically meaningful results
- Verbatim analysis – Group open-ended responses by theme to identify what your best users love most
- Roadmap prioritization – Translate insights into a Now / Next / Later action plan tied to real user feedback
Nearly 42% of startups fail simply because there was no real market need for what they built. Not because the product was poorly made — but because no one validated market demand before committing serious resources. Marc Andreessen, who coined the term “product-market fit,” described it simply as “being in a good market with a product that can satisfy that market.” That clarity sounds obvious. But most teams skip the structured analysis that actually confirms it.
I’m Clayton Johnson, an SEO strategist and growth systems expert who has worked with founders and product teams to build scalable frameworks — including helping businesses deploy a product market fit analysis template as an early foundation for demand generation. In the sections below, I’ll walk you through exactly how to use one, step by step.

How to Use a Product Market Fit Analysis Template to Validate Your Growth
When we talk about achieving product-market fit (PMF), we are essentially sailing. The product is our sail, and market demand is the wind. Without the wind, the best-designed sail in the world won’t get us anywhere. To find that wind, we need a reliable compass. That’s where a product market fit analysis template comes in.
The concept isn’t entirely new. While Marc Andreessen popularized it in his famous essay The Only Thing That Matters, the roots go back to Andy Rachleff, co-founder of Benchmark Capital, who used it to describe the alignment between business development and market reach. Later, Eric Ries integrated these ideas into The Lean Startup through the build-measure-learn feedback loop.
The Two Pillars of PMF Analysis
Most effective templates are split into two distinct parts:
- The PMF Canvas: This is a visual strategic tool. It forces us to look at the “Customer” side (target segments, pain points) and the “Product” side (value prop, features, UX) to see if they actually line up.
- The Sean Ellis Survey: Once we have a live product, we need hard data. This survey asks users one “make or break” question: “How would you feel if you could no longer use our product?”
According to research, we can assume we’ve achieved fit if at least 40% of users respond with “very disappointed.” This is known as the Sean Ellis 40% rule.
Step 1: Deploying the Product Market Fit Analysis Template Survey
To get a confident read, we can’t just survey anyone. We need to target recent, active users who have experienced the core value of the product. Avoid brand-new signups who haven’t had their “aha moment” yet.
The Survey Mechanics:
- The Goal: Aim for 40-100 responses.
- The Timeline: Collect these within a 5-10 day window to ensure the data is fresh.
- The Significance: A Buffer study on response significance suggests that even 40-50 responses are enough to start seeing statistically significant trends.
The Four Essential Questions:
- Disappointment Level: “How would you feel if you could no longer use [Product]?” (Very disappointed, Somewhat disappointed, Not disappointed).
- The “Who”: “What type of people do you think would most benefit from [Product]?” (Helps identify your high-expectation customer).
- The “Why”: “What is the main benefit you receive from [Product]?” (Reveals your true value proposition).
- The “Gap”: “How can we improve [Product] for you?” (Identifies the barriers for the “somewhat disappointed” group).
By using a structured product market fit survey template, we can operationalize this feedback loop quickly. If you want to dive deeper into how these frameworks fit into a larger growth engine, check out our more info about product-market fit systems.
Step 2: Segmenting High-Expectation Customers
One of the biggest mistakes teams make is trying to please everyone. When we analyze our product market fit analysis template results, we must be ruthless. We should focus almost exclusively on the “Very Disappointed” group.
In the famous how Superhuman found product/market fit case study, founder Rahul Vohra explained how they ignored feedback from people who wouldn’t miss the product. Instead, they doubled down on the features that the “very disappointed” group loved. These are your “High-Expectation Customers” (HXC).
How to Segment:
- Identify the users who would be very disappointed.
- Look at their “main benefit” answers. This is your core value.
- Look at the “somewhat disappointed” group. What is the one thing holding them back from becoming “very disappointed” users?
This segmentation allows us to ignore the noise and focus on the signals that lead to strategic framework alignment.

Step 3: Mapping Insights to a Strategic Roadmap
Once we have our data, we need to turn it into action. This is where we move from analysis to execution. We recommend using “Affinity Mapping”—a process of grouping open-ended responses (verbatims) into common themes.
The Prioritization Framework:
- Synthesize: Group the “How can we improve” suggestions from both the “Very” and “Somewhat” disappointed groups.
- Impact vs. Effort: Plot these themes on a matrix. Focus on high-impact, low-effort changes first.
- Now-Next-Later: Build a roadmap.
- Now: Fix the barriers for your HXC.
- Next: Build features that move “Somewhat Disappointed” users into the “Very Disappointed” camp.
- Later: Explore new verticals or advanced features.
By following Dan Olsen’s Lean Product Playbook, teams can prioritize the features that actually move the needle. For more on building these types of roadmaps, see more info about strategic frameworks.
Beyond the Survey: Quantitative Signals of True Market Fit
While surveys are fantastic for directional guidance, they are still “opinion” data. To confirm PMF, we need to look at “behavioral” data. As highlighted in Lenny’s newsletter on retention, nothing matters more than retention. If your users are leaving as fast as they are arriving, you have a “leaky bucket” that no amount of marketing can fix.
Signs you have found PMF:
- The Retention Curve Flattens: Your cohort retention curve shouldn’t go to zero. It should flatten out at a healthy percentage (e.g., 20-40% for consumer apps, 70-90% for B2B SaaS).
- Organic Growth: More than 50% of your new signups come from non-paid sources (word-of-mouth, referrals).
- Market Pull: You stop pushing the product uphill; instead, the market starts pulling it out of your hands. Customers are complaining when the site goes down, and they are asking for features faster than you can build them.
If you’re struggling to see these signals, it might be time to look into more info about business coaching to help realign your leadership team’s focus.

Measuring Success with the Product Market Fit Analysis Template Metrics
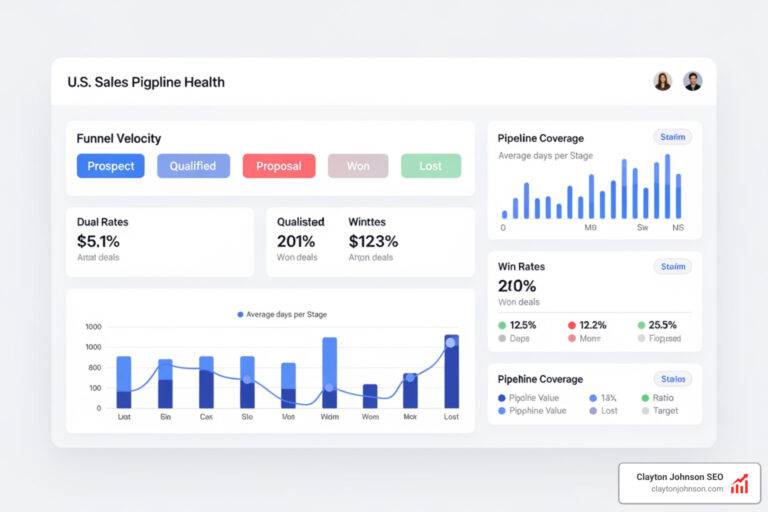
To get a complete picture, we use several “instruments” on our dashboard. Think of it like a pilot flying through clouds; you can’t just rely on one gauge.
| Metric | Benchmark for Success | Why it Matters |
|---|---|---|
| Sean Ellis Score | >40% “Very Disappointed” | Validates initial sentiment and value. |
| Retention Rate | Curve flattens (Industry dependent) | Proves the product is “sticky.” |
| Quick Ratio | >4 (New + Resurrected / Churned) | Measures the quality of your growth. |
| Organic Growth % | >50% of total growth | Indicates strong word-of-mouth. |
| Net Promoter Score | >30 (B2B) or >50 (B2C) | Measures customer loyalty and referral potential. |
When we measure your product-market fit, we must segment these metrics by persona. An average NPS might be 20, but for your target executive persona, it might be 70. That’s where the real insight lives. This level of intent modeling is a core part of a modern more info about SEO strategy.
Avoiding Common PMF Pitfalls and False Positives
Achieving PMF is not a one-time event; it’s a state of being that can be lost. Even giants like Slack and Superhuman had to iterate constantly to maintain their scores (Superhuman famously hit a 58% score, while Slack was estimated at 51% in its early days).
Common Pitfalls to Avoid:
- Scaling Too Early: Pouring money into ads before the retention curve flattens. This just accelerates your failure.
- The Niche Trap: Thinking you have PMF for the whole market when you only have it for a tiny, non-scalable niche.
- Complacency: Markets shift. Competitors arrive. If you don’t reassess your PMF every 6-12 months, you’ll find yourself with a “sail” but no “wind.”
- Vanity Metrics: Focusing on total signups or app downloads instead of active usage and retention.
As Alex Schultz on growth often points out, almost half of startups fail because they believe they have a great product but never actually validated it with the right customer. If you’re a leader navigating these waters, more info about executive coaching can provide the outside perspective needed to spot these traps.

Conclusion: Building Durable Systems with Clayton Johnson SEO
Finding product-market fit is the hardest part of the journey. But once you have it, the goal shifts from “finding the wind” to “building a faster boat.” This is where a structured approach to growth becomes your competitive advantage.
At Clayton Johnson SEO, we don’t just chase temporary traffic spikes. We build durable systems—content architectures, technical SEO foundations, and AI-augmented workflows—that turn your PMF into compounding growth. Our philosophy is simple: Clarity leads to Structure, which creates Leverage, resulting in Compounding Growth.
If you’ve used a product market fit analysis template and confirmed that the market is pulling your product, we can help you build the engine to meet that demand. Whether it’s through keyword strategy or building a taxonomy-driven content ecosystem, we focus on measurable business impact.
Ready to stop guessing and start growing with a proven system? Learn more about how we can help by checking out more info about SEO consultants. Let’s build your growth engine together.


")