You’re Competing Blind — Here’s How Competition Mapping Changes That
Competition mapping is the process of visually plotting your business and your rivals on a chart to reveal where everyone stands in the market.
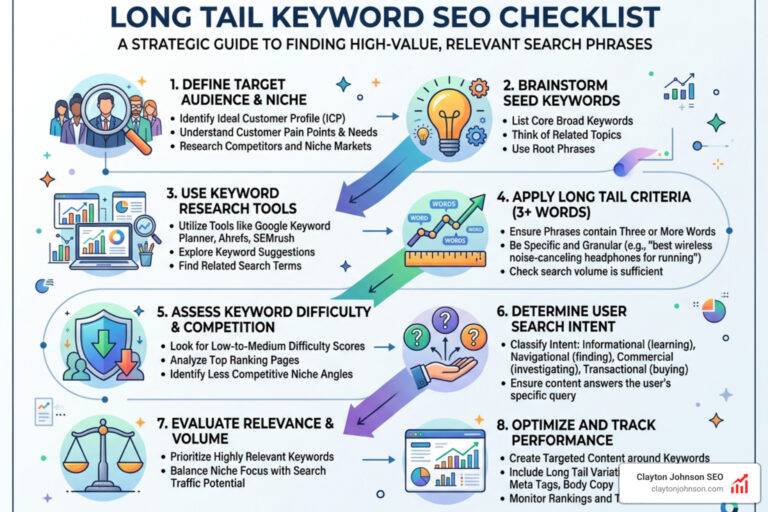
Here’s a quick breakdown of what it involves:
- What it is: A visual tool that positions competitors on a two-axis chart (e.g., price vs. quality) to reveal market dynamics at a glance
- Why it matters: It exposes gaps, crowded segments, and differentiation opportunities you’d otherwise miss
- Key steps: Define your axes, identify competitors, collect data, plot positions, and analyze clusters
- Common axes used: Price vs. quality, innovation vs. brand awareness, exclusivity vs. accessibility
- Who uses it: Startups, enterprise brands, luxury houses, SaaS companies, and anyone serious about strategic positioning
Most businesses know their competitors exist. But very few can show where they stand relative to them — and that’s a costly blind spot.
As the saying goes: you can’t navigate without a map. And in a crowded market, your competitors aren’t waiting around for you to figure out where you fit.
Competition mapping turns a fuzzy sense of “who’s out there” into a clear, visual picture of the battlefield. It helps you spot the white space, avoid the overcrowded corners, and make smarter decisions about positioning, pricing, and product development.
Whether you’re trying to break into a saturated niche or defend your market share, this guide walks you through every technique you need to do it right.

What is Competition Mapping and Why Does It Matter?
In strategic marketing, raw data can often feel like white noise. You might have a spreadsheet full of competitor prices and feature lists, but until you can see the spatial relationship between those players, you’re essentially flying a plane without radar.
Competition mapping, often referred to as perceptual mapping, is the visual representation of how different brands are positioned in the minds of consumers. By plotting companies on a two-axis grid, we can see the “landscape” of the market. This isn’t just about making a pretty chart; it’s about establishing a Strategic North Star.
When we engage in competitive analysis 101, we learn that keeping our friends close and our competitors closer is the only way to survive. Mapping takes this a step further by showing us exactly how close they are. As Richard D’Aveni noted in his work for the Harvard Business Review, mapping your competitive position allows you to see if you are stuck in a “commodity trap” or if you have successfully carved out a unique space.
Why does this matter? Because it reveals market dynamics that numbers alone cannot. It shows us where the market is “crowded” (the red oceans) and where there is “white space” (the blue oceans). For a business, this is the ultimate tool for differentiation. If every other wealth management firm in your area is positioning themselves as “Traditional and Exclusive,” there might be a massive, unmapped opportunity for a firm that positions itself as “Modern and Accessible.”
Competition mapping vs. general competitive analysis
While the terms are often used interchangeably, there is a distinct difference between the two. Think of general competitive analysis as the research phase—it’s the collection of data, the reading of SEC filings, and the tracking of social media updates.
Competition mapping, however, is the synthesis and visualization of that data. It moves us from a list of facts to a spatial understanding of the market.
- Data Visualization: While an analysis might tell you that Competitor A is cheaper than you, a map shows you exactly how much cheaper they are in relation to the rest of the market.
- Snapshot vs. Process: A competitive landscape analysis is often a point-in-time snapshot, whereas competitive intelligence is the ongoing process of monitoring. Mapping provides that vital snapshot that allows leadership to stop guessing and start positioning.
- Brand Perception: Mapping focuses heavily on how the customer perceives the brand. It’s less about what the company says they are and more about where they actually sit in the minds of the target audience.
The Step-by-Step Process of Creating a Competitor Map
Creating a competition mapping strategy doesn’t have to be an academic exercise. It’s a practical, tactical process that we use to help our clients find their footing.

Step 1: Define Your Objectives
What are you trying to find out? Are you looking for a pricing gap? Are you trying to see who owns the “innovation” space? Without a goal, your map will be cluttered and confusing.
Step 2: Data Collection and Normalization
You need reliable data to plot your points. This involves gathering info on pricing, product features, and customer sentiment. We often recommend using AI for competitive insights to speed up this process. AI can crawl reviews and social media to give you a “sentiment score” that you can then use as a coordinate on your map.
Step 3: Pattern Recognition and Strategic Grouping
Once the data is plotted, patterns will emerge. You’ll see clusters of companies that all behave similarly. These are your “strategic groups.” If you are a small boutique firm, you might find you’re competing more with other boutiques than with the “Big Box” enterprise firms, even if you offer similar services.
Identifying direct, indirect, and potential competitors
A common mistake in competition mapping is only looking at the people who do exactly what you do. To get a true sense of the market, you need to look at the entire ecosystem.
- Direct Competitors: These are the people offering the same solution to the same problem (e.g., another wealth management firm).
- Indirect Competitors: These are companies solving the same problem with a different approach. For a wealth manager, an indirect competitor might be a “Robo-advisor” or even a DIY tax software.
- Potential Competitors: These are the “emerging players” who might not be in your space yet but have the resources to enter it.
- Market Substitutes: Think about the Five Competitive Forces defined by Michael Porter. A substitute for a luxury hotel might not be another hotel; it might be a high-end Airbnb or a luxury yacht rental.
One of the best ways to find these hidden rivals is through churn analysis. When customers leave you, where are they going? Often, they aren’t going to a direct rival; they’re going to an “alternative” that you hadn’t even considered.
Selecting the right axes for your competition mapping
The “magic” of a competitor map lies in the axes you choose. If you choose the wrong criteria, your map will tell you nothing useful. The axes should represent the factors that are most important to your customers’ decision-making process.
| Industry | Axis X (Horizontal) | Axis Y (Vertical) |
|---|---|---|
| SaaS | Feature Depth | Ease of Use |
| Luxury Goods | Heritage/Tradition | Innovation/Trendiness |
| Wealth Management | Personalization | Digital Integration |
| Retail | Price Point | Brand Prestige |
| EdTech | Subject Breadth | Degree of Personalization |
For a wealth management firm, you might plot Trust/Reputation against Technological Sophistication. This would help you see if there’s a gap for a firm that is both highly trusted and highly tech-forward—a rare combination in a traditional industry.
Essential Frameworks and Tools for Visualizing the Market
While a simple 2×2 grid is the most common form of a competitor map, there are several other strategic frameworks for analysis that can add depth to your mapping.
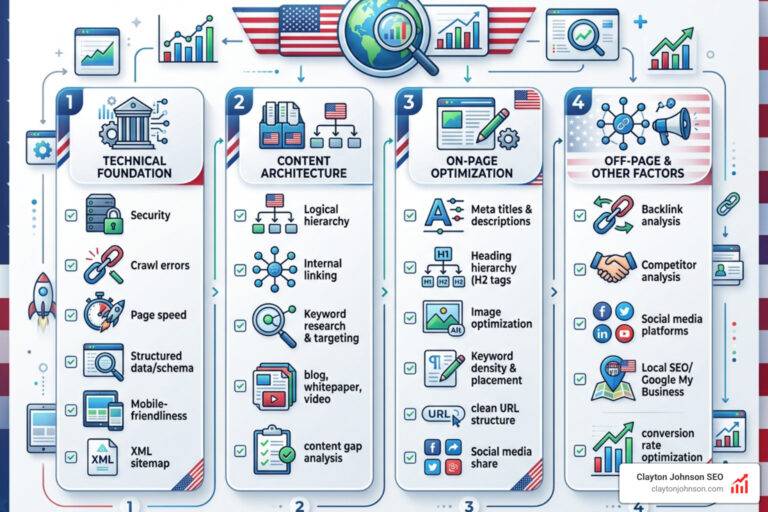
- SWOT Analysis: This is the foundational diagnostic tool. Before you map others, you must map yourself. What are your Strengths, Weaknesses, Opportunities, and Threats?
- BCG Growth-Share Matrix: This helps you visualize your product portfolio. Are your services “Stars” (high growth, high share) or “Cash Cows”? Mapping your competitors’ products this way can tell you where they are likely to invest their future marketing dollars.
- Porter’s Five Forces: This framework zooms out to look at the market-analysis/porters-five-forces that shape your industry, such as the bargaining power of buyers and the threat of new entrants.
- PEST Analysis: This maps the macro-environmental factors—Political, Economic, Social, and Technological—that act like the “weather” your competitive landscape operates in.
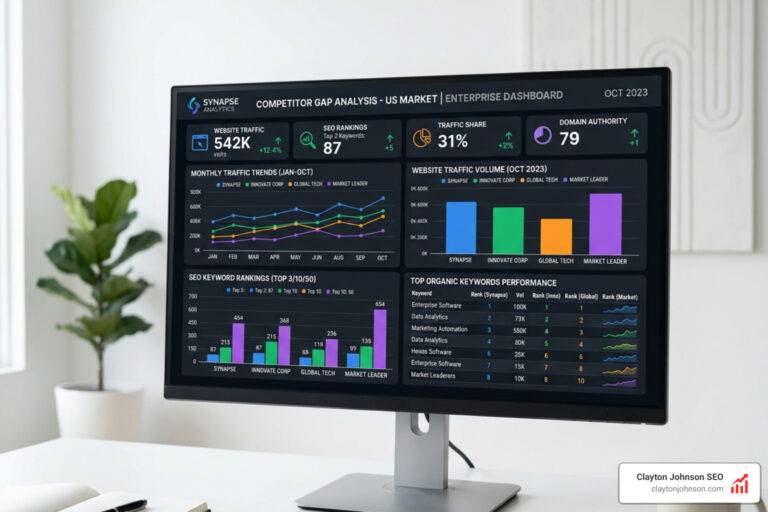
Top tools for digital competitive intelligence
We don’t have to rely on gut feelings. There are incredible AI competitive analysis tools that can do the heavy lifting for us.
- SEMrush & Ahrefs: These are essential for mapping your “Digital Share of Voice.” Who owns the keywords you want? Who is getting the most organic traffic?
- Google Trends: Great for mapping “Brand Awareness” over time. Is interest in your competitor growing or shrinking?
- Brandwatch: Excellent for sentiment mapping. It can tell you how people feel about your rivals across the web.
- Creately: A visual mapping tool that offers templates for quadrant charts, Venn diagrams, and spider charts.
- SimilarWeb: Useful for seeing where your competitors’ traffic comes from—is it search, social, or referrals?
By combining these tools, you can how to score your brand with AI and create a data-driven map that is far more accurate than anything drawn on a whiteboard.
Real-World Applications: From Luxury Goods to SaaS
To truly understand competition mapping, it helps to see it in action across different industries. Every sector has its own “gravity,” and the maps reflect that.
In the SaaS world, competition is often described as a “red ocean”—fierce, crowded, and bloody. Here, mapping is used to find a “well-defined niche.” For example, a project management tool might map itself against giants like Asana or Monday.com. By using axes like “Agile Specialization” vs. “Task Simplicity,” they might find a gap for a tool specifically designed for Agile software developers who find the big players too “bloated.”
In EdTech, a startup might use mapping to identify a niche in high personalization for STEM subjects. By plotting competitors on axes of “Subject Breadth” and “Level of Personalization,” they can visualize exactly where the market is underserved.
Case study: Positioning in the luxury industry
The luxury industry is perhaps the most sophisticated user of competition mapping. In luxury, price is rarely the primary differentiator; instead, it’s about perceived value, exclusivity, and brand identity.
When mapping luxury goods, the axes often shift to:
- Heritage vs. Innovation: Is the brand a “venerable maison” with 200 years of history, or a “disruptor” using new materials and tech?
- Awareness vs. Exclusivity: Does everyone know the brand (high awareness), or is it a “secret” for the ultra-wealthy (high exclusivity)?
For example, in the high-end jewelry sector, a brand might find that the “High Awareness/High Heritage” quadrant is crowded with names like Cartier and Tiffany. However, there might be a “white space” in the “High Innovation/High Exclusivity” quadrant—targeting younger, tech-savvy billionaires who want something unique and modern rather than traditional.
In the hospitality sector, luxury hotels often map “Service Quality” against “Experiential Immersion.” A hotel that offers both world-class service and deep immersion in nature (like a luxury safari lodge) can charge a significant premium because they sit in a sparsely populated area of the map.
Common Pitfalls and Best Practices for Ongoing Success
Even with the best tools, competition mapping can go wrong if you aren’t careful. One of the biggest dangers is confirmation bias. This is the tendency to choose axes and data that prove you are the best. To avoid this, we always recommend using objective, third-party data whenever possible.
Another common mistake is static reporting. A map is not a “one and done” project. Markets are fluid. New competitors pop up overnight (especially in SaaS), and consumer preferences shift. If your map is six months old, you’re navigating with an outdated chart.
Here are our best practices for long-term success:
- Quarterly Refreshes: At a minimum, you should update your map every quarter. This allows you to track “motion”—are competitors moving toward your space? Are they lowering their prices?
- Actionable Insights: A map is useless if it doesn’t lead to a decision. Every time you update your map, ask: “So what?” Does this mean we need to change our pricing? Do we need to launch a new feature?
- Internal Alignment: Ensure that your marketing, sales, and product teams are all looking at the same map. This creates a unified strategy for how to think about competitive pressure.
- Data Accuracy: Triangulate your data. Don’t just trust a competitor’s website; look at their SEC filings, their customer reviews, and their digital footprint.
Frequently Asked Questions about Competition Mapping
How do I identify market gaps using a competitor map?
Look for the “white space.” When you plot your competitors, you will often see them clustered together in one or two quadrants. The empty areas of the map represent unmet customer needs or under-exploited niches. However, be careful—sometimes a space is empty because there is no demand there. Always validate a gap with customer research before jumping in.
How often should a business update its competitive map?
It depends on your industry’s market volatility. If you are in a fast-moving field like AI or SaaS, you might need to check for “real-time signals” monthly. For more stable industries like wealth management, a deep-dive quarterly review is usually sufficient. Always trigger a refresh after a major market event, such as a competitor’s merger or a significant technological shift.
Can startups use competition mapping for product development?
Absolutely. In fact, they should. For a startup, mapping is essential for USP (Unique Selling Proposition) formation. By mapping the existing players, a startup can identify exactly which features are “table stakes” (feature parity) and which ones will actually differentiate them. This helps in resource prioritization—don’t spend your limited budget building something that five other people already do better.
Conclusion
Strategic planning is not about working harder; it’s about positioning yourself smarter. Competition mapping provides the visual clarity needed to move from a defensive posture to one of market leadership. It allows you to see the moves your rivals are making before they even make them.
At Clayton Johnson SEO, we specialize in helping firms—particularly in the wealth management sector—navigate these complex digital landscapes. Our specialized SEO strategies are built on a foundation of deep competitive intelligence. We don’t just want you to rank; we want you to own the space that your competitors haven’t even discovered yet.
Ready to find your white space? Explore our Strategic Frameworks for Competitive Analysis and let’s start mapping your way to the top.


")