Why the SVA Balanced Scorecard Approach Matters for Strategic Leaders
The SVA balanced scorecard approach integrates Shareholder Value Added (SVA) methodology—which explicitly measures value creation through free cash flow drivers—into the Balanced Scorecard’s four perspectives (Financial, Customer, Internal Processes, Learning & Growth). This fusion transforms the scorecard from a performance dashboard into a value-based strategic management system that links operational decisions to wealth creation.
Quick Framework Overview:
| Component | Purpose | Key Output |
|---|---|---|
| SVA Value Drivers | Sales growth, margins, capital efficiency, cost of capital | Present value of cash flows + residual value |
| Financial Perspective | Replace lagging accounting metrics (ROI, EPS) with forward-looking value measures | EVA, performance spread, invested capital |
| Customer/Process/Learning | Connect operational excellence to value drivers | Customer lifetime value, cycle time, innovation rate |
| Strategic Integration | Translate value objectives into departmental KPIs | Aligned initiatives across all organizational levels |
Traditional financial measures like return-on-investment give misleading signals for continuous improvement and innovation. As companies compete on information and intangible assets, the ability to track how today’s actions build tomorrow’s shareholder value becomes decisive. SVA provides the valuation engine—identifying specific drivers like sales growth rates, profit margin trajectories, and capital requirements—while the Balanced Scorecard provides the operational translation across customer satisfaction, internal processes, and learning capabilities.
About 60% of Fortune 1000 companies use some form of scorecard system, yet many still rely on backward-looking accounting ratios in their financial perspective. The SVA integration addresses this gap by embedding value-driver economics directly into strategic measurement.
I’m Clayton Johnson, and I’ve built growth infrastructure for founder-operators by integrating strategic valuation principles with execution frameworks like the SVA balanced scorecard approach. This guide distills how value-based thinking transforms scorecards from reporting tools into strategic navigation systems.

Explore more about SVA balanced scorecard approach:
- EVA scorecard design guide
- Financial & Value Metrics
- shareholder value analysis model
Understanding the Fundamentals of the SVA Balanced Scorecard Approach
To truly master the SVA balanced scorecard approach, we have to look at the two giants of management theory that make it work. On one side, we have Alfred Rappaport’s Shareholder Value Added (SVA) methodology, which focuses on the hard math of wealth creation. On the other, we have Robert Kaplan and David Norton’s Balanced Scorecard (BSC), which focuses on the operational levers that move that math.
When we combine them, we move from just “measuring things” to Using the Balanced Scorecard as a Strategic Management System. This integration is what we call Strategic Enterprise Management (SEM). It’s the difference between looking at a map of where you were yesterday and using a GPS that tells you exactly how to get to your destination today.
Defining Shareholder Value Added (SVA)
SVA isn’t just a fancy accounting term; it’s a mindset. It posits that a company’s value is determined by the present value of its future cash flows, discounted at the cost of capital.
The core components include:
- Free Cash Flow: The actual cash the business generates after paying for operations and investments.
- Cost of Capital: The minimum return investors expect for the risk they are taking.
- Competitive Advantage Period (CAP): The window of time during which we expect to earn returns above our cost of capital.
- Residual Value: What the company is worth at the end of that forecast period.
By focusing on these, we stop worrying about “accounting profits” (which can be manipulated) and start focusing on “economic value” (which is what actually builds wealth).
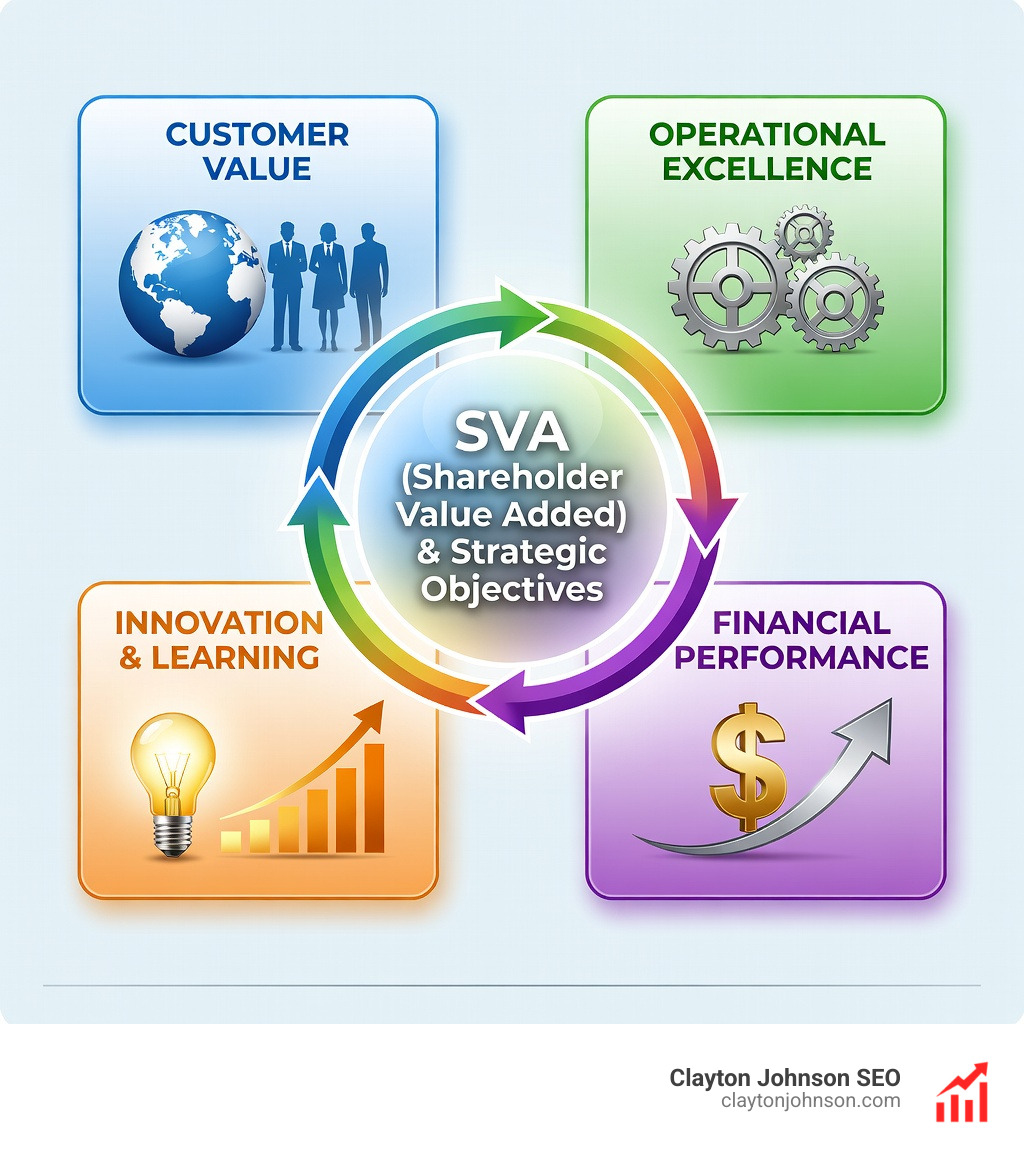
The Four Perspectives of the Balanced Scorecard
The Balanced Scorecard was born from a simple realization: what you measure is what you get. If you only measure money, your employees will find ways to make money today while potentially destroying the company’s future. To prevent this, the BSC looks at four distinct perspectives:
- Financial: How do we look to shareholders? (In our approach, this is where SVA shines).
- Customer: How do customers see us? (Think: lead time, quality, and performance).
- Internal Business Processes: What must we excel at? (Core competencies and cycle times).
- Learning and Growth: Can we continue to improve and create value? (Employee skills and innovation).
We use strategy maps to draw lines between these. For example, if we train our employees better (Learning), they will improve our process efficiency (Internal), which makes customers happier (Customer), which ultimately drives higher sales growth and margins (Financial/SVA).

Why Integrate SVA Value Drivers into Your Scorecard?
Why go through the trouble of merging these two? Because it solves the “so what?” problem. Many boards look at high customer satisfaction scores and ask, “So what? Is this making us more valuable?” The SVA balanced scorecard approach provides the answer.
By integrating SVA, we align every operational metric with the ultimate goal of wealth maximization. This makes our metrics forward-looking. Instead of reporting that we had a good quarter, we can show the board that our current initiatives are extending our Competitive Advantage Period, which increases the company’s total valuation right now.
Moving Beyond Lagging Financial Indicators
Traditional accounting measures like ROI and EPS are “lagging” indicators. They tell you what happened last month or last year. Relying solely on them is like trying to drive a car by only looking in the rearview mirror.
In a modern environment—especially for companies in Minneapolis where competition for top talent and innovation is fierce—we need real-time data. We use Strategic Variance Analysis to understand why our income changed. Did it change because of sales volume, or because we became more productive? SVA-driven scorecards highlight these distinctions.
Enhancing the Financial Perspective with SVA
When we “SVA-ify” the financial perspective, we replace generic profit targets with value creation metrics. We look at the performance spread (the difference between our return on capital and the cost of that capital). If the spread is positive, we are creating value. If it’s negative, we are actually destroying wealth, even if our accounting software says we are “profitable.”
We also incorporate Economic Value Added (EVA) to provide a clear dollar amount of the value created during a specific period. This keeps the board focused on capital efficiency, not just top-line growth.

How to Build an SVA-Driven Financial Perspective
Building this isn’t rocket science, but it does require moving away from the standard P&L view. We need to identify the specific levers that drive cash.
| Metric Type | Traditional Metric | SVA-Integrated Metric | Why it Matters |
|---|---|---|---|
| Growth | Revenue Growth % | Sales Growth Rate (Faded) | Accounts for market saturation and competition over time. |
| Profit | Net Income | Operating Profit Margin (Post-Tax) | Focuses on the core business performance without debt noise. |
| Capital | Total Assets | Fixed & Working Capital Investment | Measures how much cash is “trapped” to generate those sales. |
| Efficiency | ROI | Performance Spread (EVA/IC) | Shows if you are earning more than the cost of your resources. |
Step-by-Step: Building an SVA Balanced Scorecard Approach
To get started, we recommend following this sequence:
- Identify Value Drivers: Use resources like the Using Value Drivers to Increase Business Value eGuide | SVA to pinpoint what actually moves the needle in your industry.
- Set Baseline Sales: Establish where you are today.
- Determine Cost of Capital: Calculate your WACC (Weighted Average Cost of Capital).
- Calculate PV of Operating Cash Flows: Forecast your cash flows over the next 5-10 years and discount them back to today’s dollars.
Incorporating Forward-Looking Value Drivers
To make the scorecard truly “balanced,” we must include drivers that impact the future “Residual Value” of the firm. This includes:
- Working Capital Efficiency: How quickly are we turning inventory and receivables into cash?
- Fixed Capital Investment: Are we investing in the right technology to lower long-term costs?
- Debt Valuation: How is our leverage affecting our risk profile and cost of capital?
By tracking these, we can evaluate strategic alternatives. If the board is choosing between a new product launch or an acquisition, we can model which one adds more SVA to the balance sheet.
Aligning Non-Financial Perspectives with Shareholder Wealth
This is where the “Balanced” part of the scorecard comes into play. We don’t just want to know the SVA numbers; we want to know what activities are creating them.
Supporting SVA through Customer and Internal Processes
If our SVA model says we need 10% sales growth to hit our valuation targets, the Customer Perspective tells us how to get it. We might track Customer Lifetime Value (CLV) or on-time delivery rates.
On the internal side, we look at defect rates and cycle times. For example, reducing a service delivery time from 5 days to 3 days isn’t just a “nice to have”—it lowers working capital requirements and increases customer retention, both of which are direct SVA drivers. We often see that The Automation Imperative plays a huge role here; automating routine tasks can cut error rates in half and boost ROI by 50% or more.
For those looking to dive deeper into the data side of this, check out our more info about analytics services to see how we track these metrics in real-time.

Fostering Innovation and Learning for Long-Term Value
The Learning and Growth perspective is the foundation of the entire house. If you don’t have the right employee skills or a culture of continuous improvement, your processes will eventually fail, your customers will leave, and your SVA will tank.
Key metrics to track here include:
- % of Sales from New Products: This measures your R&D effectiveness.
- Employee Skill Gap Reductions: Are we training people for the skills we’ll need in three years?
- Proprietary Product Development: Patents and unique IP extend your Competitive Advantage Period, which is a massive lever for residual value.
Implementing the SVA Balanced Scorecard Approach: Best Practices and Metrics
Implementation is where most companies stumble. They build a beautiful scorecard and then leave it in a PDF on a shared drive. To avoid this, we use a structured 90-day roadmap.

Overcoming Challenges in the SVA Balanced Scorecard Approach
The biggest hurdle isn’t the math; it’s the people. Change management is critical. You are asking managers to stop looking at “their” budget and start looking at “our” value creation.
Common pitfalls include:
- Data Silos: The finance team has the SVA data, but the operations team has the process data. They need to talk.
- Metric Overload: Don’t track 50 things. Pick the 5 “vital few” for each perspective.
- Resource Allocation: If a project doesn’t drive a value driver, stop doing it.
We highly recommend reviewing Managing Change in the Workplace to help navigate the cultural shifts required for this transition.
Sustaining Effectiveness through Continuous Innovation
A scorecard is a living document. We use Agile cycles to review our metrics every two weeks. If a “leading indicator” (like customer satisfaction) is up, but our “lagging indicator” (SVA) is down, it means our strategy is wrong, and we need to pivot.
We also establish feedback loops with stakeholders. This ensures that the board isn’t just seeing a report; they are participating in a strategic dialogue about how to allocate capital for the highest possible return.
Frequently Asked Questions about SVA and Scorecards
How does SVA differ from traditional ROI in a Balanced Scorecard?
Traditional ROI is an accounting ratio based on historical costs and profits. It doesn’t account for the cost of equity capital or the time value of money. SVA is an economic measure that looks at future cash flows and subtracts the full cost of capital (both debt and equity). SVA tells you if you are creating wealth; ROI only tells you if you are “making money” according to the accountants.
Can small businesses use the SVA balanced scorecard approach?
Absolutely. While the math might be simpler, the principles are the same. A small service firm in Minneapolis can use SVA to decide whether to hire a new consultant or invest in a new CRM. By modeling the impact on cash flow and the cost of that investment, they make better, value-centric decisions.
What are the most critical value drivers for service-based organizations?
For service businesses, the most critical drivers are usually Customer Lifetime Value (CLV), Capacity Utilization, and Service Delivery Cycle Time. Since service firms are often asset-light, their value is tied almost entirely to their ability to generate high-margin recurring revenue from their human capital.
Conclusion
The SVA balanced scorecard approach is more than just a measurement tool; it is a structured growth architecture. It bridges the gap between the high-level goals of the board and the daily activities of the front-line staff. By grounding every metric in the hard reality of value creation, we ensure that our growth is not just fast, but sustainable and wealth-generating.
At Demandflow and Clayton Johnson SEO, we believe that clarity leads to structure, and structure leads to compounding growth. If your board meetings are currently a snooze-fest of backward-looking spreadsheets, it’s time to change the conversation.
Work with me to build your growth infrastructure and let’s turn your strategy into a value-creating engine.