Why AI Augmented Analytics Workflows Are Replacing Traditional BI
AI augmented analytics workflows combine machine learning, natural language processing, and automation to turn raw data into actionable insights — faster and with far less manual effort than traditional BI tools.
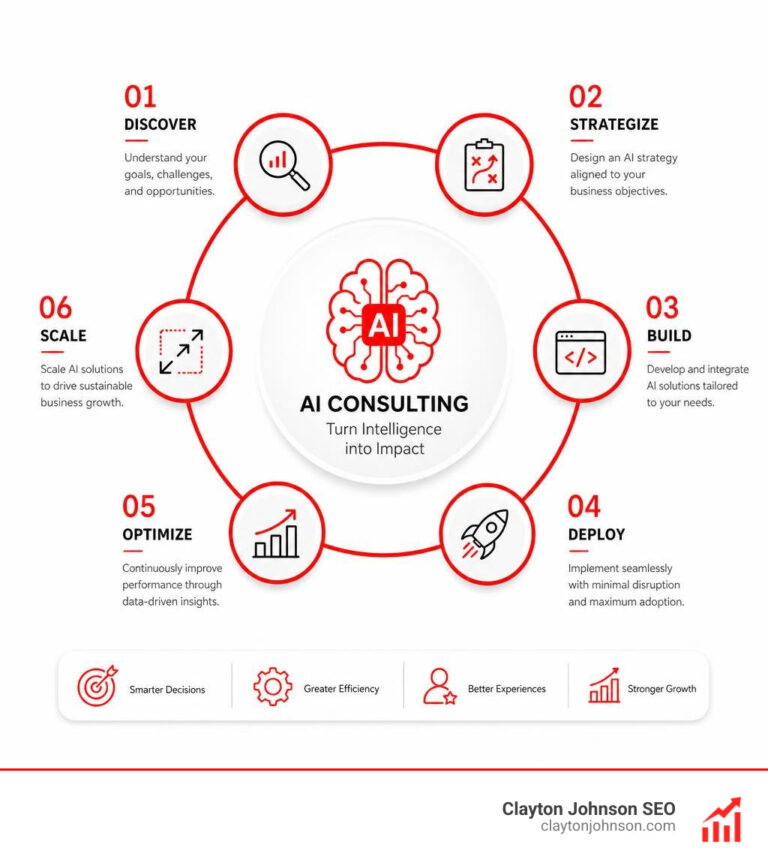
Here is how they work at a glance:
- Ingest — Connect to data sources automatically
- Prepare — AI cleans, joins, and enriches data without manual wrangling
- Explore — Ask questions in plain language; AI translates them into queries
- Discover — Automated insight engines surface trends, anomalies, and root causes
- Deliver — Insights reach decision-makers as narratives, dashboards, or alerts
- Act — Prescriptive recommendations guide next steps in real time
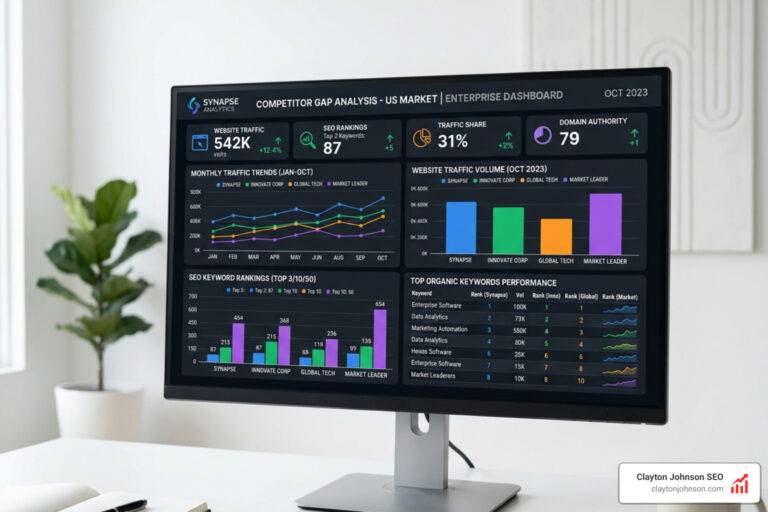
Data analysts currently spend up to 80% of their time cleaning and merging data from disparate sources. AI augmented analytics cuts that bottleneck dramatically — reducing time-to-insight by up to 60% and pushing BI adoption from roughly 30% to over 50% across business teams.
The core problem with traditional analytics is not a lack of data. It is insight lag — the gap between when data is available and when a decision-maker can actually use it. Most teams are still running static reports, waiting on analysts, and missing decision windows entirely.
AI changes that equation. Instead of waiting for the right query, augmented analytics surfaces what matters before you think to ask.
I’m Clayton Johnson — SEO strategist and growth operator specializing in AI-augmented marketing and analytics workflows. My work building scalable, structured systems for founders and marketing leaders gives me a ground-level view of exactly where AI augmented analytics workflows create leverage — and where teams leave that leverage on the table.

Key AI augmented analytics workflows vocabulary:
The Strategic Shift to AI Augmented Analytics Workflows
We are witnessing a fundamental change in how organizations handle information. Gartner defines augmented analytics as the use of enabling technologies like machine learning and AI to assist with data preparation, insight generation, and insight explanation. This isn’t just a “nice-to-have” feature; it is a direct response to the “architectural gap” found in traditional Business Intelligence (BI) tools.
Legacy BI platforms were designed for a world that no longer exists—a world where data stayed in neat silos, questions were static, and stakeholders could wait a week for a PDF report. Today, the sheer volume of data makes manual wrangling impossible to scale. We need proactive intelligence that flags an unexpected dip in customer engagement before a human even thinks to run a query.

Transitioning from Static Reports to Dynamic Knowledge
The goal of any research or analytics project is to provide value at the exact moment a decision is being made. As Nielsen Norman Group notes, teams benefit most when insights are discoverable at decision-making moments. Traditional research distribution often fails because it optimizes for the “initial delivery” rather than “ongoing accessibility.”
By implementing AI augmented analytics workflows, we transform one-time reports into a fluid distribution of organizational knowledge. Instead of digging through old emails, a stakeholder can ask a Slack bot, “What do we know about our homepage conversion?” and receive an evidence-based answer instantly. This makes high-value analysis a routine part of daily operations. For those looking to build this infrastructure, check out our analytics and data services.
Overcoming the 80% Data Preparation Bottleneck
It is a well-known (and frustrating) industry fact: data engineers and analysts spend up to 80% of their time on the “grunt work” of cleaning, transforming, and merging data. This is where AI provides the most immediate ROI.
Through smart ETL (Extract, Transform, Load) pipelines and automated profiling, AI can identify inconsistencies, suggest “smart joins” between disparate tables, and even perform data imputation to fill in missing values. By enriching the schema with business-centric metadata, we give the AI the context it needs to understand that “C123” actually refers to “Customer Lifetime Value,” eliminating the guesswork that usually plagues manual preparation.
Core Components of the Augmented Analytics Stack
To build a high-leverage growth operating system, we have to understand the “engine” under the hood. Augmented analytics isn’t a single tool; it is a stack of technologies working in concert.
- Machine Learning (ML): The core technology that learns from historical patterns to predict outcomes, detect outliers, and recommend actions.
- Natural Language Processing (NLP): This allows us to interact with data using human language. It’s the difference between writing a complex SQL join and asking, “Why did sales drop in the Midwest?”
- Natural Language Generation (NLG): This takes the numbers and turns them into a story. It writes the “executive summary” for you.
- Automation: The “glue” that handles repetitive tasks like data ingestion and report distribution.
What is Augmented Analytics? At its heart, it is about expanding human capability, not replacing it. It provides a unified semantic layer—a “single source of truth”—that ensures everyone in the company is using the same definitions for key metrics.
Automating Data Preparation in AI Augmented Analytics Workflows
Manual data prep is prone to human error and bias. AI-assisted workflows use algorithms like Isolation Forests for anomaly detection and K-nearest neighbors (KNN) for data imputation.
| Feature | Manual Preparation | AI-Assisted Preparation |
|---|---|---|
| Speed | Days or Weeks | Minutes or Hours |
| Error Rate | High (Human Fatigue) | Low (Algorithmic Consistency) |
| Scalability | Limited by Headcount | Virtually Unlimited |
| Context | Relies on Tribal Knowledge | Uses Embedded Metadata/Annotations |
By using these tools, we ensure that the data fed into our models is clean, consistent, and ready for high-stakes decision-making.
Scaling Insights with AI Augmented Analytics Workflows
Once the data is clean, the AI begins “Automated Insight Discovery.” This means the system is constantly scanning datasets for statistically significant patterns and correlations without an analyst having to formulate a specific hypothesis.
For example, an AI agent might notice that a specific cohort of users in the Northeast has a 20% higher churn rate when they interact with a specific app version. It performs the root cause analysis and flags it for the product team automatically. This level of pattern recognition at scale is simply beyond human bandwidth.
Transforming the Data Analytics Lifecycle
The traditional analytics lifecycle is a linear, often slow process. AI turns it into a self-optimizing loop.
- Data Ingestion: Smart connectors automatically pull from CRM, SEO tools, and financial databases.
- Model Development: Tools like AutoML allow non-experts to build predictive models for churn or lead scoring.
- Insight Delivery: Instead of a static dashboard, stakeholders receive adaptive visualizations tailored to their specific role.
- Prescriptive Recommendations: The system doesn’t just say “Sales are down”; it suggests, “Reallocate 10% of the budget to LinkedIn ads to close the Q4 gap.”
 and outputting clear, actionable strategy icons — white background enterprise corporate style - AI augmented analytics workflows")
From Natural Language Query to Conversational Analytics
The most sought-after capability in modern analytics isn’t actually a better chart—it’s the ability to talk to the data. Conversational analytics goes beyond simple text-to-SQL translation. It assesses user intent and maintains context across a conversation.
If you ask, “Show me last month’s revenue,” and then follow up with, “What about the same period last year?” the AI understands that “the same period” refers to the month and “last year” modifies the previous context. This democratizes data, allowing a Sales Manager or CEO to get answers without waiting for a ticket to clear the data team’s queue.
Generative AI and the Future of Narrative Reporting
McKinsey research on GenAI productivity suggests that GenAI could automate 60%–70% of data processing tasks. In the context of analytics, this means moving from dashboards to dynamic narratives.
Imagine an AI that doesn’t just show a line graph but generates a three-paragraph summary explaining why the line moved, using synthetic data to run “what-if” scenarios. It can create “decision playbooks” for your team, outlining the best course of action based on historical successes. This is the ultimate “leverage” in a growth operating system.
Real-World Impact and Industry Use Cases
The ROI of AI augmented analytics workflows isn’t theoretical. We see it in the metrics: a 60% reduction in time-to-insight and an 80% reduction in manual data prep effort.
, Finance ($700k/month loss mitigation), Retail (25% increase in order value), and CPG ($6M+ savings in FTE costs) — white background enterprise corporate style - AI augmented analytics workflows infographic")
Healthcare and Life Sciences
In the life sciences sector, augmented analytics has led to a 66% growth in patient starts for specific treatments. By analyzing vast medical records and clinical trial data, AI helps providers improve diagnostic accuracy and identify high-risk patients earlier. One global organization reported $1.6 million in resource savings by automating their data-to-insight pipeline.
Financial Services and Retail
A top 10 financial services firm saved over $700,000 per month in mitigated credit losses by using AI to accelerate risk analysis. In retail, AI-augmented workflows drive hyper-personalization. By analyzing shopper insights in real-time, brands have increased average order values by 25% and significantly reduced cart abandonment rates.
Best Practices for AI Enrichment and Research Integrity
To make these systems work, you can’t just “plug in” an AI and hope for the best. You need a structured strategy. At Demandflow.ai, we focus on building a taxonomy-driven architecture that ensures the AI has a clear “map” of your business.
- Taxonomy & Shared Tagging: Use a consistent naming convention across all departments.
- Metadata Enrichment: Don’t just name a column “Date”; specify if it’s “CustomerAcquisitionDate” or “LastLoginDate.”
- Evidence Linking: Ensure AI outputs always link back to the original data source (transcripts, SQL tables, or survey results) to maintain research rigor.
- Researcher Validation: AI should accelerate the work, but a human should provide the final strategic context.
Maintaining Analytical Rigor in Qualitative Data
Analytics isn’t just about numbers; it’s about people. For UX research, this means centralizing coded transcripts and thematic frameworks. By organizing insights by journey stages (e.g., Awareness, Consideration, Purchase), we make qualitative findings as searchable and actionable as quantitative ones. This transforms “one-off” user interviews into a cumulative knowledge base.
Structuring Databases for LLM Accuracy
Database schemas are often opaque. To improve LLM accuracy, we use “AI enrichment”—adding business-centric annotations to your tables. This helps the AI understand that a table named “T1” is actually your “AnnualRecurringRevenue” table. Grouping related tables into “business domains” reduces the search space for the AI, leading to much more accurate SQL generation.
What is the difference between augmented analytics and automation?
Automation is about removing the human from the loop to perform a repetitive task (like moving data from point A to point B). Augmented analytics is about enhancing the human. It uses AI to surface insights, but still requires human domain knowledge to make the final strategic decision.
How does AI reduce the time spent on data preparation?
AI automates the most tedious parts of the job: identifying duplicate records, fixing formatting errors, suggesting joins between tables, and handling unstructured data (like customer reviews). This allows analysts to focus on strategy rather than data cleaning.
What are the main benefits of conversational analytics for business users?
The biggest benefit is democratization. Business users don’t need to learn SQL or wait for a data analyst. They can ask questions in plain English and get immediate, visualized answers, which leads to much higher adoption of data-driven decision-making across the company.
Conclusion
The future of business isn’t just about having more data; it’s about having better structure. At Clayton Johnson, we believe that clarity leads to structure, which leads to leverage, and finally to compounding growth. By adopting AI augmented analytics workflows, you aren’t just buying a tool—you are building a structured growth architecture.
If you are ready to move from “insight lag” to “insight leadership,” we can help you design and implement the systems that turn your data into a competitive advantage.
Build your AI-augmented SEO and analytics infrastructure with Demandflow.ai today.


")