See Your Market Clearly With a Marketing Position Map
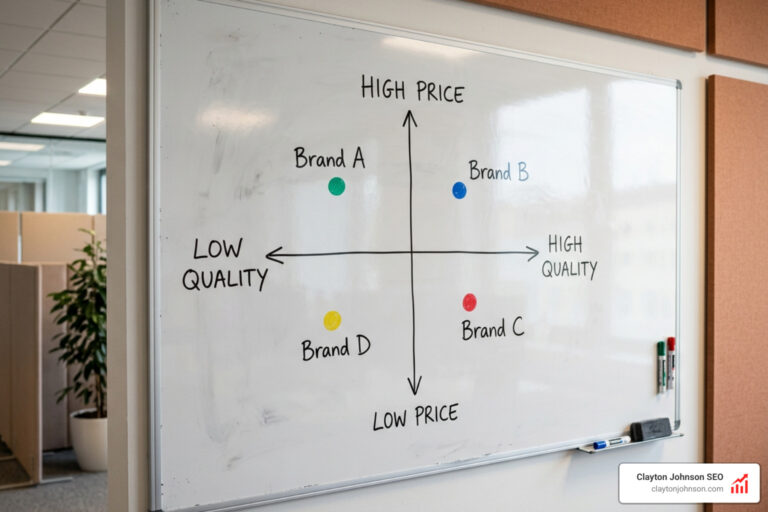
A marketing position map is a simple chart that shows where your brand and competitors sit in customers’ minds. Choose two buying factors that matter most – such as price and perceived benefit – gather customer-backed scores, plot each option, and look for crowded areas, pricing risks, and underserved needs.
For a small business owner, the value is practical: a position map helps you stop copying competitors and start making clearer choices about your offer, pricing, website messaging, and target audience. A blank space is not automatically an opportunity, but it is a useful question to investigate: Do customers want something here, and can we deliver it profitably?
The best maps separate what your company intends to stand for from what buyers actually perceive. They turn a vague competitive landscape into a visual tool for better decisions.
I am Clayton Johnson, an SEO strategist and digital marketing entrepreneur with more than a decade of experience in competitive analysis, customer acquisition, brand strategy, and search visibility. I use marketing position map research to help businesses connect a distinct market message with the terms, content, and conversion paths their ideal customers use online.
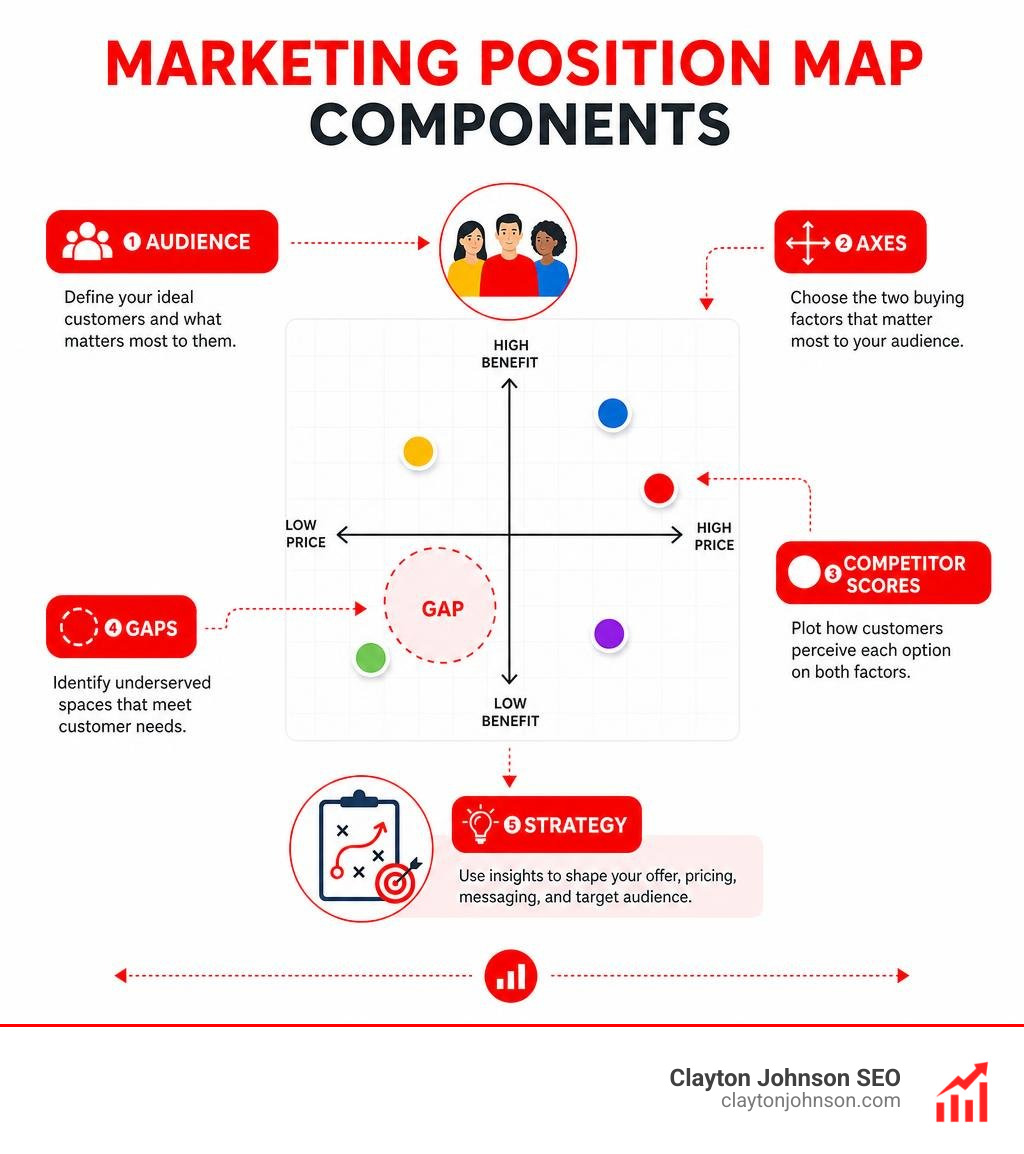
Simple guide to marketing position map terms:
What Is a Marketing Position Map and Why Does It Matter?
Every buying decision happens in a crowded mental room. When a prospect searches for a solution, they rarely evaluate your product in isolation. Instead, their brain instantly categorizes your offer relative to the alternatives they already know. If your brand does not explicitly define and claim a distinct space in that mental landscape, the market will assign one for you—and it is rarely the one you want.
At its core, a marketing position map transforms abstract buyer psychology into a tangible, two-dimensional coordinate plane. By plotting competitors along specific, high-impact buying criteria, we can visualize how the market organizes itself, where value is concentrated, and where customer needs remain completely unmet.
In the fast-moving landscape of 2026, relying on gut feeling to steer your value proposition is a fast track to irrelevance. Modern buyers are inundated with choices across search engines, social feeds, and software platforms. A visual mapping model strips away internal corporate assumptions, showing exactly how well your brand differentiates itself in the wild.
| Dimension | Perceptual Map | Competitive Positioning Map |
|---|---|---|
| Primary Focus | Subjective customer attitudes and brand associations | Strategic value exchange, pricing power, and capability metrics |
| Typical Axes | Qualitative traits (e.g., Traditional vs. Modern, Fun vs. Serious) | Economic metrics (e.g., Realized Net Price vs. Perceived Benefit Index) |
| Core Use Case | Brand identity, creative messaging, and design differentiation | Pricing strategy, product portfolio roadmaps, and commercial positioning |
| Primary Data Input | Consumer sentiment surveys, focus groups, and brand association tests | Conjoint analysis, MaxDiff research, feature weighting, and total cost of ownership (TCO) |
| Key Output | Brand perception gaps and emotional whitespace | Pricing risks, margin vulnerability, and market white space |
Defining the Marketing Position Map vs. Perceptual Maps
Marketers often use the terms positioning map and perceptual map interchangeably, but understanding their technical distinction makes your strategic execution far sharper. A perceptual mapping framework plots products based entirely on subjective, qualitative customer sentiments. These maps capture descriptive attributes like “playful versus corporate” or “approachable versus exclusive.” They reflect where customers currently see your product in their minds.
Conversely, a competitive marketing position map evaluates commercial and economic reality. It frequently pits realized pricing against a composite perceived benefit score derived from weighted product features, service quality, and performance reliability. While perceptual mapping helps creative teams design visual identities and logos, positioning mapping informs executive decisions about pricing tiers, core feature sets, and go-to-market strategies.
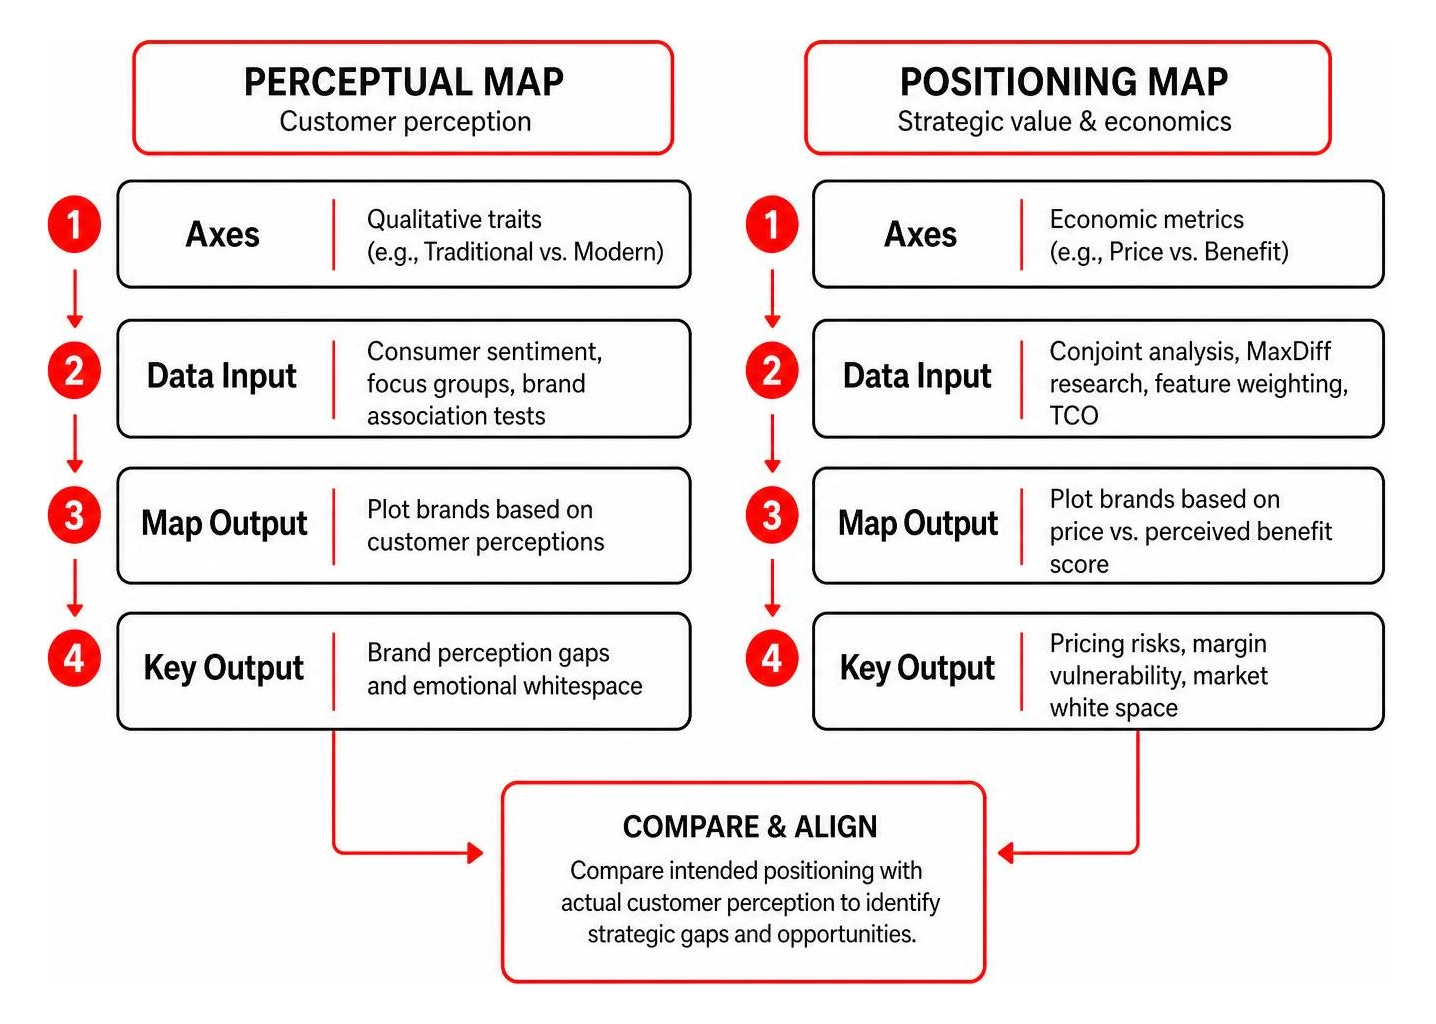
When we evaluate both models together, we can compare intended positioning against actual customer perception. If our executive team intends for our service to be seen as a premium, high-capability solution, but perceptual research places us in the low-trust, low-capability bracket, we have identified a critical strategic breakdown.
Core Strategic Benefits for Brand Differentiation
Why invest the time to construct a rigorous position map? Because building a business without one is like navigating an unfamiliar city without GPS. You might keep moving, but you will waste immense fuel along the way.
- Combating Micro-Attention Spans: A consumer makes their mind up about a brand’s website in a few milliseconds. If your core differentiation is not immediately obvious the moment they land on your page, they bounce back to the search results. A clear position map ensures your top-of-page messaging immediately answers what makes you distinct.
- Selecting Winning market positioning models: Instead of trying to be everything to everyone, visual mapping forces your leadership team to pick a specific posture—whether that is a cost leader, a specialized niche expert, or a premium innovator.
- Establishing Defensible Competitive Advantage: Mapping reveals where legacy incumbents are clustered together fighting over identical value propositions. It allows you to deliberately step outside their crosshairs and own an uncontested operational position.
- Achieving Cross-Functional Alignment: Product teams, sales reps, and content marketers often hold conflicting views of what the company actually sells. A shared positioning matrix acts as a single source of strategic truth across every department.
Key Dimensions and Matrix Dynamics: Price vs. Benefit
The most reliable, commercially actionable coordinate system for a competitive position map places Realized Price on one axis (typically the Y-axis or X-axis) and Perceived Benefit on the other.

Perceived benefit is not a single feature; it is a composite score reflecting the overall utility, performance, support quality, and brand trust a customer believes they receive. Realized price represents the true economic cost to the buyer, factoring in discounts, subscription commitments, and onboarding overhead rather than just an arbitrary list price.
Decoding the Four Quadrants in a Market Matrix
When we construct a classic Price vs. Benefit matrix, four operational zones emerge. Understanding these quadrants is vital when surveying the field with a competitive landscape map:
- The Economy / Value Quadrant (Low Price, Moderate/Low Benefit): Inhabited by cost-effective alternatives and commoditized baseline tools. Brands here win through massive volume, hyper-efficient operational delivery, and self-serve onboarding.
- The Premium / Differentiated Quadrant (High Price, High Benefit): Home to market leaders and high-touch enterprise solutions. Customers happily pay a substantial price premium because the perceived outcome, security, or prestige far outweighs the financial investment.
- The High-Value Disruptor Quadrant (Low/Moderate Price, High Benefit): The most aggressive posture in any industry. Disruptors enter this space with superior technology or leaner operating models, giving buyers high-end capabilities at accessible rates. This quadrant attracts rapid customer adoption but requires disciplined capital management to remain profitable.
- The Danger / Overpriced Zone (High Price, Low Benefit): Brands lingering in this quadrant suffer from severe margin vulnerability. They charge legacy prices without delivering modern value. Companies trapped here face rapid churn as soon as customers discover modern alternatives.
The Value Equivalence Line and Pricing Power
Within any stable market matrix runs a diagonal benchmark known as the Value Equivalence Line (VEL). The VEL represents the fair-value trajectory where price matches perceived customer benefits in direct proportion.
When competitors sit directly on the VEL, the market is in relative pricing equilibrium. A buyer paying 20% more expects roughly 20% greater utility.
However, strategic opportunities emerge when brands drift away from this diagonal:
- Positions Below the VEL (Value Advantaged): Offerings plotted below the line deliver superior benefit relative to their price point. These companies gain market share rapidly and possess substantial pricing power—they can systematically raise prices without sacrificing deal volume.
- Positions Above the VEL (Value Disadvantaged): Offerings above the line represent poor value-for-money. Unless protected by extreme regulatory moats or painful customer switching costs, these brands inevitably lose market share to lower-priced or higher-performing rivals.
Step-by-Step Guide to Building a Marketing Position Map
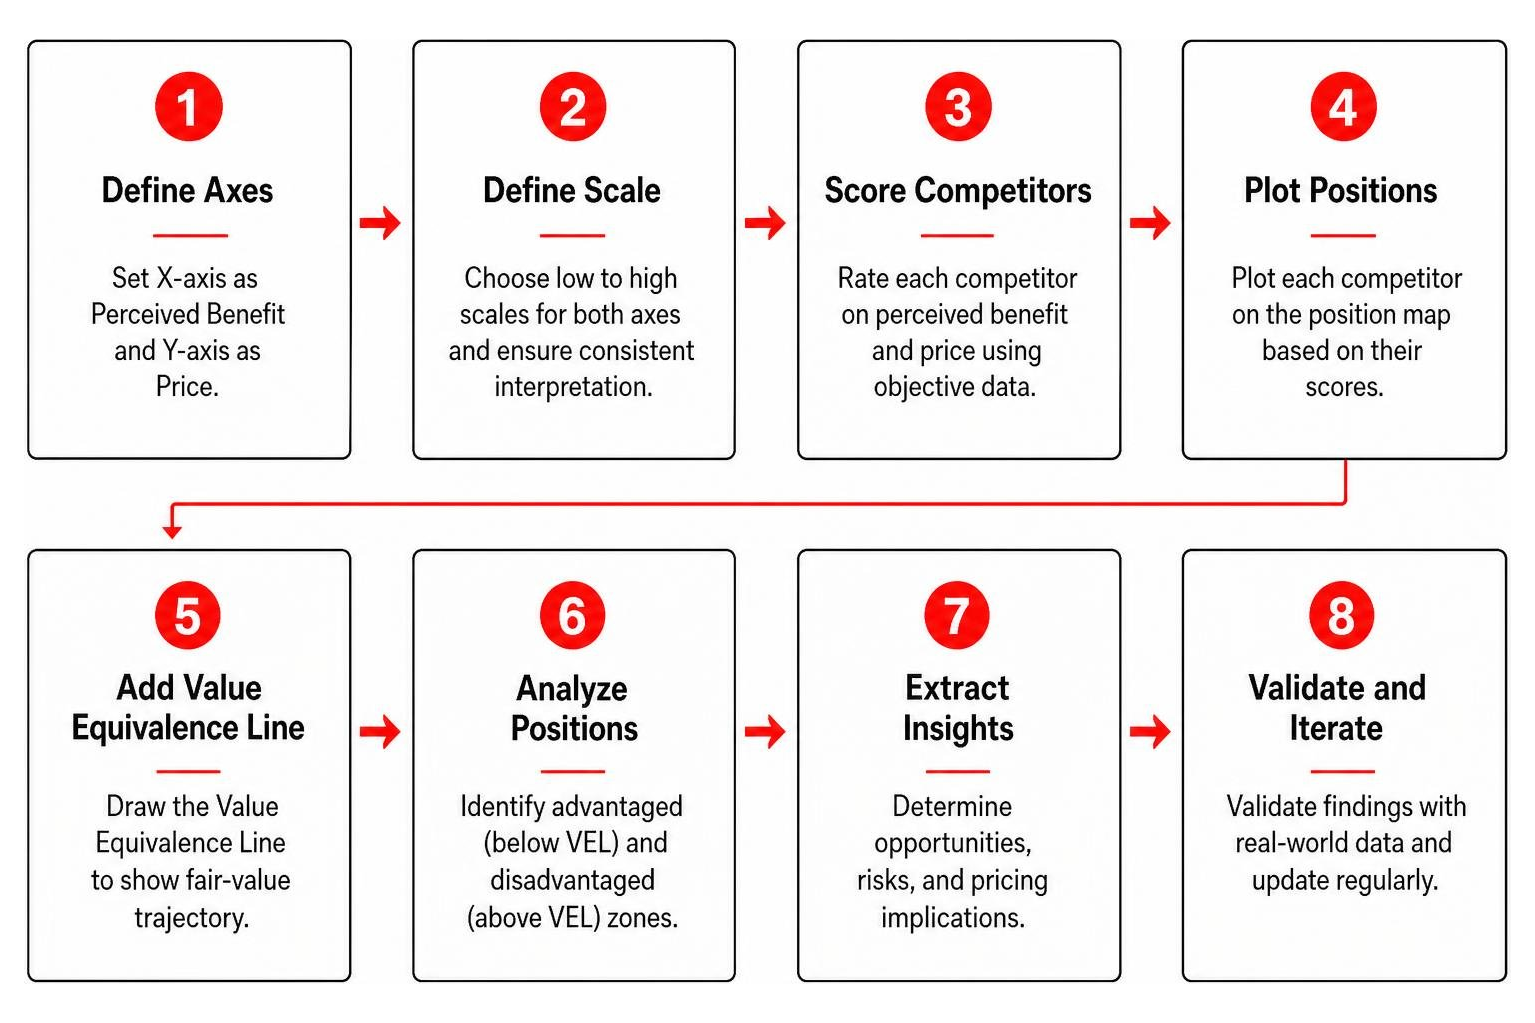
Building an executive-grade map requires transitioning from subjective assumptions to structured, repeatable research. Here is our direct operational framework.
Gathering Quantitative and Perceptual Data Sources
An accurate map depends entirely on the integrity of your data inputs. Never plot competitors based solely on an internal brainstorming session; internal teams naturally overestimate their own product benefits while downplaying rival capabilities.
To build an objective dataset:
- Conjoint Analysis and MaxDiff Surveys: Ask target buyers to make realistic trade-offs between specific features, support levels, and pricing tiers to establish statistical attribute weights.
- Customer Discovery Interviews: Conduct 10 to 30 structured qualitative interviews with recent buyers and lost prospects to uncover the exact criteria driving their purchasing choices.
- Search Intent Analysis: Google processes over 3.5 billion searches a day. By analyzing the commercial search queries prospects use, we can see which problems, comparisons, and feature sets dominate buyer interest.
- Social and Review Sentiment: In 2020, 3.96 billion people were using social platforms. Mining user feedback across third-party review sites, professional forums, and social communities provides an unfiltered look at competitor strengths and product weaknesses.
How to Construct Your Marketing Position Map Across Strategic Axes
Once your data is compiled, follow this sequence to plot the matrix:
- Select Two Dominant Axes: Choose the primary purchase drivers identified in your customer research (e.g., Net Realized Price vs. a Composite Capabilities Index).
- Standardize and Normalize the Scores: Convert all customer benefit ratings into a normalized 0-to-100 index so diverse metrics (like speed, customer support, and integrations) can be evaluated uniformly.
- Map Competitor Coordinates: Plot each competing solution on the grid based on their calculated price and benefit scores.
- Size Bubbles by Market Share: Use varying bubble diameters to visualize the revenue, search visibility, or market share of each player. This immediately highlights whether a market space is dominated by a giant or fragmented across boutique providers.
For teams looking for interactive walkthroughs, following a step-by-step perceptual map creation process ensures your scoring formulas remain mathematically sound.
Uncovering Market White Space and Competitive Gaps
With your competitors plotted, step back and examine the spatial clustering. Where are brands piling on top of each other? Where are the wide-open expanses on the grid?

Spotting an empty zone—frequently called market white space—is the primary goal of competitive analysis. However, you must evaluate white space with a critical eye. A gap in the low-price, ultra-high-service quadrant might be empty simply because no company can operate that business model without going bankrupt.
Viable white space represents an underserved buyer segment with real commercial demand. When you identify genuine opportunity areas through strategic SEO position mapping, you can build targeted landing pages, author authoritative content, and tailor your core offers directly to those neglected search intents, winning lucrative market share before competitors react. If you want to explore web-based mapping workflows, learning how to create a positioning map online and outsmart your competitors provides an efficient way to test alternative attribute combinations.
Governance, Execution, and Avoiding Common Strategic Mistakes
A marketing position map is not a one-and-done slide to present at an annual retreat and promptly forget. It is a living strategic governance tool that must actively inform product roadmaps, sales battlecards, and digital search strategies.
Executing a positioning strategy across a growing company requires cross-functional marketing teams with clearly defined operational competencies. Tools like the RevelOne Marketing Skills Map illustrate how marketing organizations structure core talent across brand, demand generation, product marketing, and operations to translate strategic positioning into pipeline growth.
Map Refresh Cadence in Dynamic Markets
Markets are never static. Competitors roll out new features, cut prices, revamp their brand messaging, and launch aggressive search campaigns. Macroeconomic conditions shift buyer willingness to pay.
- Quarterly Health Checks: Re-evaluate your positioning coordinates every quarter during your business reviews. Look for subtle shifts in competitor pricing and track digital share-of-voice changes.
- Event-Driven Audits: Immediately update your position map whenever a major competitor raises significant capital, merges with another player, or undergoes a massive product pivot.
- Annual Comprehensive Recalibration: Run fresh customer surveys and sentiment mining annually to prevent perception drift—the gradual divergence between what you believe your brand represents and how the market actually sees you.
Critical Positioning Pitfalls to Avoid
Even seasoned strategists stumble when building market position maps. Watch out for these common traps:
- Internal Confirmation Bias: Relying on internal executive opinion rather than customer data. If your team scores your own product a 95/100 on customer support without empirical backing, your resulting map is useless fiction.
- Conflating List Price with Net Realized Price: Many enterprise B2B companies discount heavily off their published rates. Mapping competitors using list prices gives an inaccurate view of true transaction economics.
- Collapsing Multiple Audiences into One Map: Enterprise buyers and small business owners evaluate benefits through completely different lenses. Always generate separate positioning maps for distinct customer segments.
- Overcomplicating the Coordinates: Trying to compress six disparate variables onto a single 2D visual breeds confusion. If you need to assess multiple dimensions, build a series of clean 2×2 matrices rather than a cluttered, illegible chart.
Frequently Asked Questions About Positioning Maps
How often should a business update its market landscape analysis?
A business should audit its positioning map quarterly and conduct a thorough, data-backed research update at least once a year. In high-velocity sectors like SaaS or e-commerce, tracking monthly digital search trends and competitor pricing shifts ensures you catch aggressive market disruptions early.
Can early-stage startups benefit from competitive position mapping?
Yes. Startups benefit tremendously because they cannot afford to fight well-funded incumbents head-on. By running rapid desk research, customer discovery interviews, and search intent analysis, a startup can pinpoint exact market white spaces, craft focused value propositions, and avoid costly pricing mistakes during launch.
How do you measure perceived benefits objectively without internal bias?
The most objective approach is combining quantitative research methods—such as MaxDiff scaling and choice-based conjoint analysis—with third-party data collection. Survey actual target prospects who have no stake in your company, and harvest verified user review ratings across public platforms to establish weighted, unvarnished benefit scores.
Conclusion
A clear marketing position map strips the guesswork out of strategic growth. By plotting your competitive landscape along verified dimensions of price and customer-perceived benefit, you instantly expose market clustering, identify overpricing vulnerabilities, and uncover profitable white space waiting to be claimed.
At Clayton Johnson SEO, we help businesses pair rigorous market positioning with high-performance search visibility. Uncovering your unique market position is only half the battle; capturing demand requires connecting that distinct value proposition to the exact search queries and content experiences your ideal buyers rely on every day. If you are ready to refine your strategic edge and dominate your market niche, explore our in-depth competitive positioning guide to start building your advantage today.