What Every Small Business Owner Should Know About Perceptual Maps
A perceptual map is a simple visual tool that shows where your brand sits in your customers’ minds — compared to every competitor in your market.
Quick answer: A perceptual map plots brands on a two-axis grid based on how customers perceive them, not how companies describe themselves. It helps you spot gaps, understand competition, and sharpen your positioning.
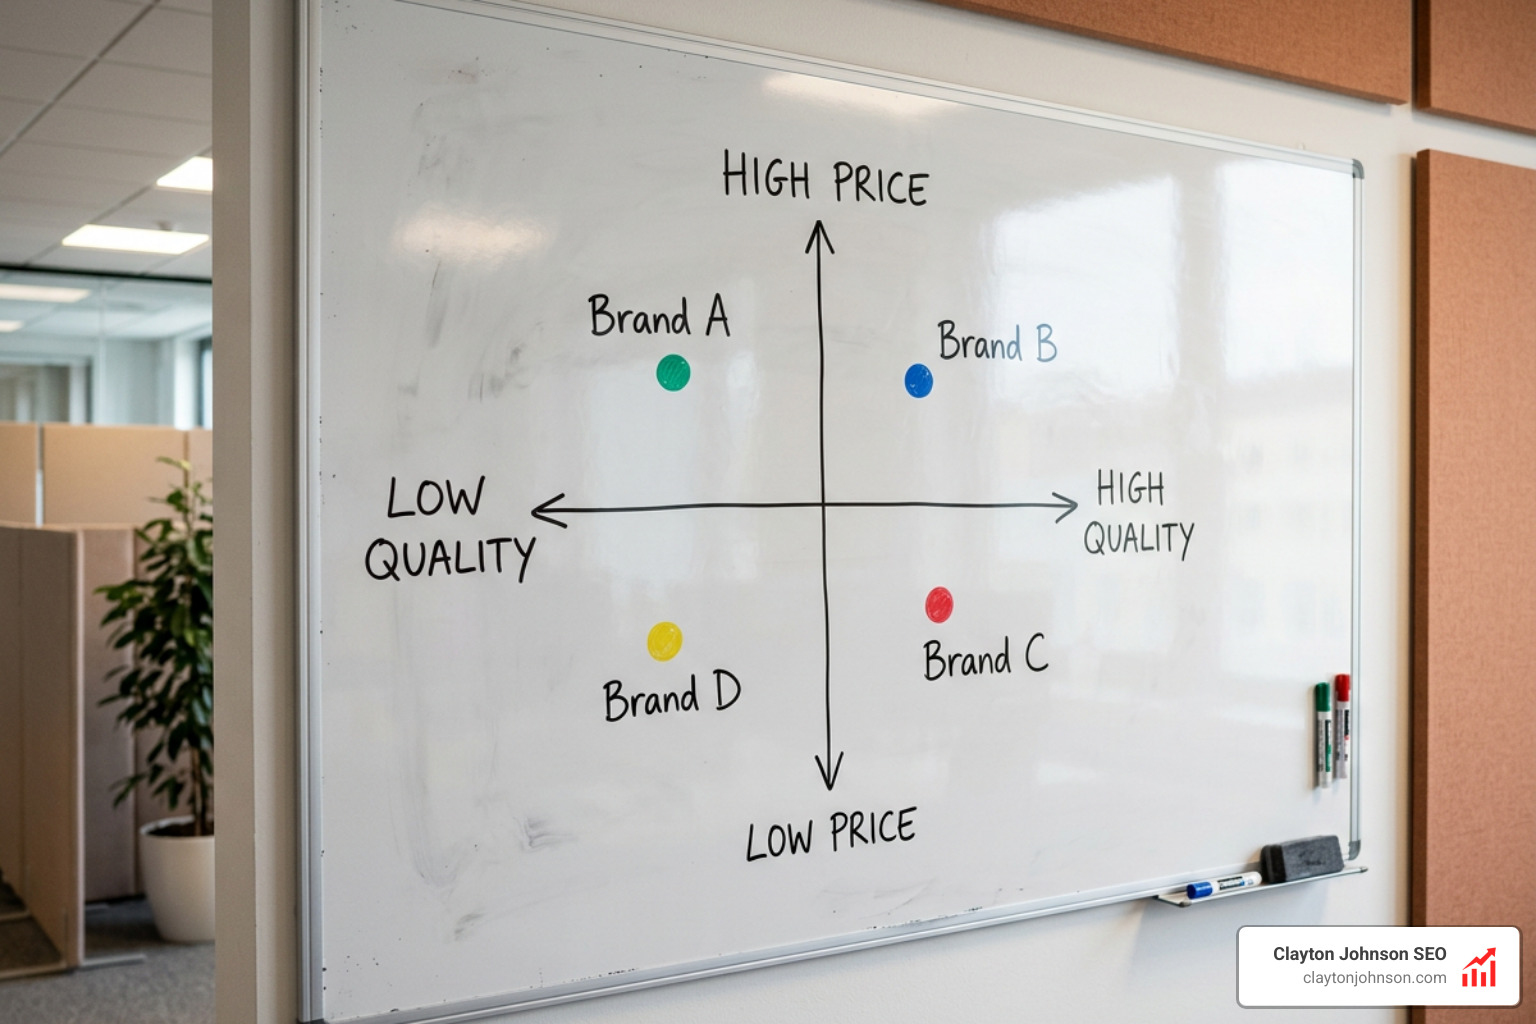
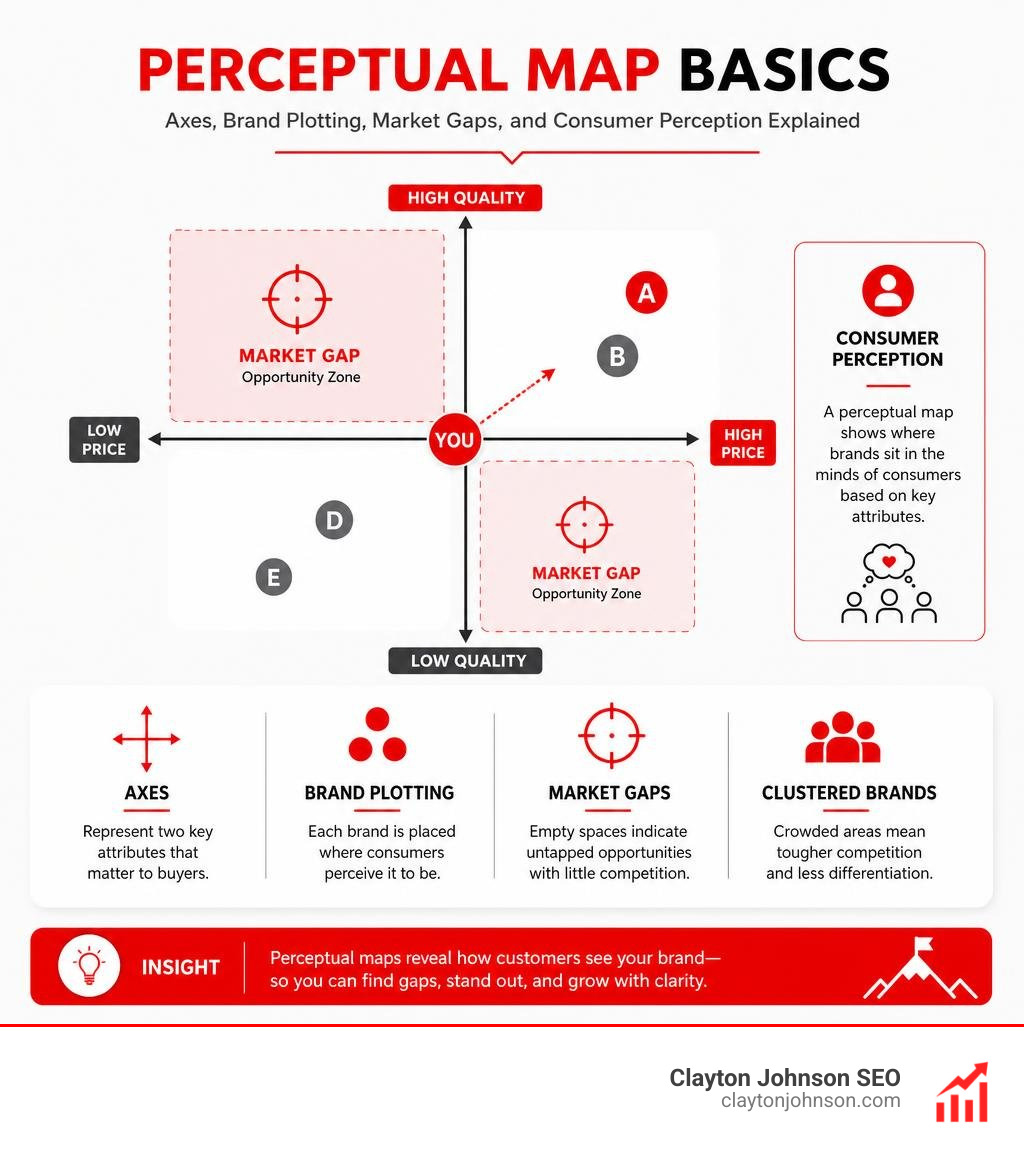
Here is what a basic perceptual map shows at a glance:
| Element | What It Means |
|---|---|
| X and Y axes | Two attributes buyers care about (e.g., price, quality) |
| Brand positions | Where customers think each brand sits on those attributes |
| Empty quadrants | Potential market gaps with little or no competition |
| Clustered brands | Crowded segments where differentiation is harder |
Most business owners assume they know how customers see them. The research tells a different story. While 80% of CEOs believe they deliver a superior customer experience, only 8% of their customers agree. That gap — between how you see your brand and how buyers actually see it — is exactly what perceptual mapping is designed to expose.
This guide walks you through everything: what perceptual maps are, why they matter, how to build one, and how to turn the results into real positioning decisions.
I’m Clayton Johnson, an SEO strategist and founder of Clayton Johnson SEO, and I’ve used perceptual map analysis as a core part of competitive research and brand positioning strategy for businesses across industries. Understanding how customers perceive brands — and where the gaps live — is foundational to the content and search strategies I build for clients.
Perceptual map basics:
What is a Perceptual Map?
At its core, a perceptual map (often referred to as a market map or product map) is a diagrammatic technique used to visually display the perceptions of customers or potential customers. It serves as a visual representation of how different offerings are positioned in consumer minds relative to the competition.
In marketing, perception is reality. A business may believe it manufactures an upmarket, highly reliable product. However, if the market views that product as a budget-friendly, low-quality alternative, it is the consumer’s perception—not the company’s internal belief—that ultimately dictates sales, brand equity, and market share.
The concept of brand positioning was formally introduced to the business world by marketing pioneers Jack Trout and Al Ries in their seminal 1981 book, Positioning: The Battle for Your Mind. They argued that the marketplace is cluttered with noise, and to survive, a brand must carve out a unique, simplified space in the prospect’s mind.
Historically, the underlying science of Perceptual mapping traces its roots back to the 1960s with early pioneers like Wendell R. Smith and Harry Beckwith. It relies heavily on multidimensional scaling (MDS), a statistical technique borrowed from cognitive psychology in the 1950s to map how people perceive similarity and difference between various objects. To explore this deeper, check out The Ultimate Guide to Market Positioning Models to see how these models integrate into modern business growth.
Customer Perception vs. Strategic Group Mapping
It is incredibly common for marketing teams to confuse a perceptual map with a strategic group map. While they may look visually similar—both typically utilize a two-axis grid—they measure entirely different things.
A strategic group map measures actual firm choices. It plots competitors based on objective, quantifiable corporate data such as pricing structures, physical footprint, feature counts, or marketing budgets.
A perceptual map, on the other hand, measures customer perception of those choices. It works with the stories, feelings, and beliefs that consumers hold in their minds, which are often highly subjective and can lag behind a company’s actual strategy.
The gap between these two maps is precisely where positioning opportunities—and critical strategic errors—hide. If your strategic group map shows you have the most advanced features in your space, but your perceptual map reveals that customers perceive your software as basic and outdated, your issue isn’t product development; it’s brand communication.
| Feature | Perceptual Map | Strategic Group Map |
|---|---|---|
| Primary Data Source | Customer surveys, online reviews, focus groups | Financial statements, public feature lists, objective pricing |
| Focus | How customers feel and perceive the brand | What the company actually does and offers |
| Axes Variables | Subjective attributes (e.g., “trustworthiness,” “modernity”) | Objective metrics (e.g., “geographic reach,” “number of locations”) |
| Primary Use Case | Identifying communication gaps, brand repositioning | Competitor financial benchmarking, M&A target identification |
The Strategic Benefits of Perceptual Mapping
When we design marketing campaigns for our clients, we don’t guess where they fit in the market. We use data-driven insights. Utilizing a perceptual map provides several key strategic advantages:
- Unbiased Market Segmentation: Instead of grouping your audience by generic demographics like age or location, perceptual mapping helps you segment the market based on how different groups value specific product attributes.
- Deep Competitive Analysis: It allows you to see who your true competitors are in the eyes of the consumer. Sometimes, your closest competitor isn’t the startup selling the same product, but a legacy brand from an entirely different category.
- Precision Product Positioning: It helps you craft a compelling brand positioning statement that highlights your unique value proposition. If you want to understand how to build this foundation, read our Market Positioning Strategy Complete Guide.
- Identifying Market Gaps: By mapping out the competitive landscape, you can easily spot “white spaces”—quadrants on the map where consumer demand exists but no competitor currently sits.
- Avoiding Commoditization: Commoditization occurs when customers perceive products to be so identical and interchangeable that price becomes the sole distinguishing factor. A perceptual map helps you identify and double down on the emotional drivers and unique attributes that keep your brand from falling into a price-war trap.
Real-World Positioning Examples
To see how these principles work in practice, let’s look at how different industries apply perceptual mapping to win market share.
1. The Automotive Industry (Price vs. Sportiness)
In the automotive space, brands are constantly battling for mental real estate. A classic perceptual mapping exercise plots vehicles on the dimensions of classy/conservative vs. sporty and affordable vs. expensive.
For example, when Mazda launched its famous “Zoom-Zoom” campaign, its strategic goal was to shift its position on the map. It wanted to move further toward the “sporty” axis to appeal to driving enthusiasts, but without raising its price perception into the luxury tier. By tracking this shift on a perceptual map, they could ensure their marketing communication was working as intended.
2. The Fast Food Industry (Price vs. Quality Perception)
In a crowded market like fast food, brands use perceptual maps to find underserved niches. For years, the market was divided between ultra-cheap, low-quality fast food and expensive sit-down restaurants.
In the early 2000s, fast-casual brands realized there was a massive, empty “white space” in the quadrant representing “fast-food prices, sit-down quality.” By positioning themselves squarely in this gap, brands like Chipotle and Panera captured a highly profitable market segment of health-conscious, budget-minded diners.
3. B2B Software (Ease of Use vs. Feature Depth)
For B2B SaaS companies, the battle is often fought on the axes of ease of use and feature depth.

Many legacy enterprise tools occupy the “deep features, but highly complex and hard to use” quadrant. This leaves a massive opportunity for startups to enter the “highly intuitive and easy to use, yet feature-rich” quadrant. This highly profitable but underoccupied space is exactly where modern product-led growth brands focus their positioning efforts, as detailed in “Perceptual Mapping: How to Position Your Brand (With Examples)”.
How to Build and Analyze Your Own Map
Building a perceptual map is not just an academic exercise; it is a practical roadmap to understanding your market. It requires transitioning from internal assumptions to objective customer data.
We often see business teams make the mistake of building “intuitive maps” (also known as judgmental or consensus maps). These are maps created entirely by internal executives based on their own beliefs about the industry. While they can be a great starting point to reveal internal biases, they should never be used to make major financial or strategic decisions. You must gather real perception data from actual customers.
To learn how to align your competitive research with visual frameworks, read our guide on how to Map Your Way to the Top with Competition Mapping.
Step-by-Step: How to Create a Perceptual Map
To build an accurate, data-driven perceptual map, we recommend following this systematic process:
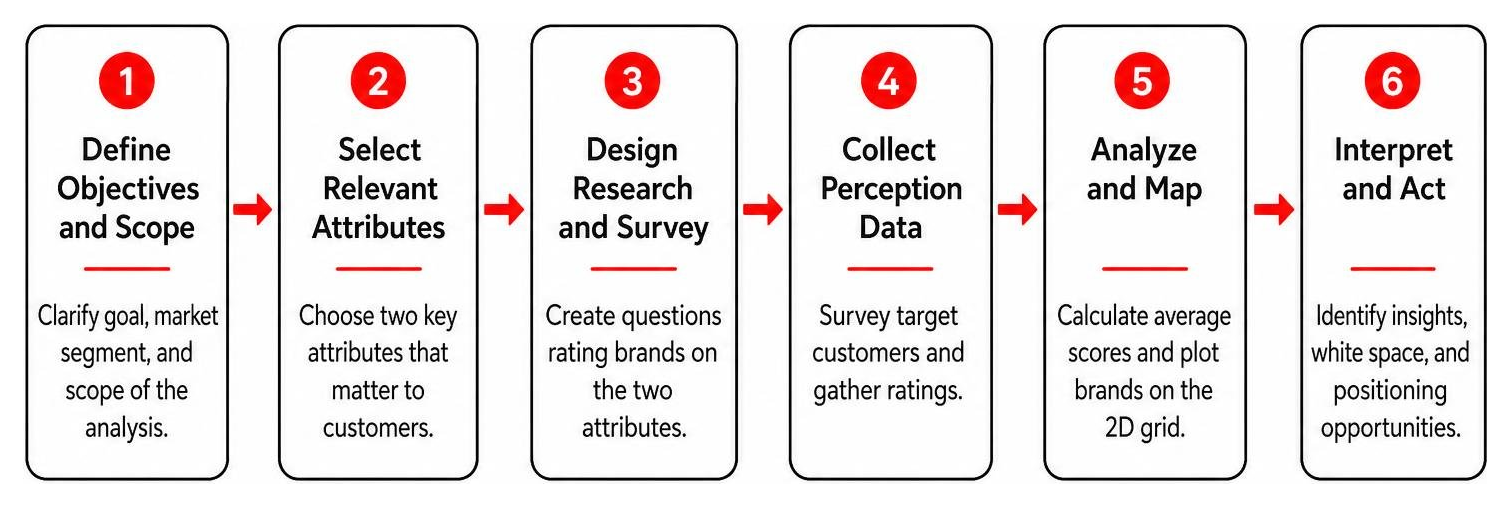
Step 1: Define Objectives and Scope
Before collecting data, clarify what you want to achieve. Are you analyzing your entire brand, a specific product line, or a new market you want to enter? Define the target audience or market segment you want to focus on, as perceptions can vary wildly between different demographics.
Step 2: Select Relevant Attributes
Choose two attributes that buyers actually use to make their purchasing decisions (e.g., quality, price, reliability, ease of use, or emotional factors like status). Avoid “vanity axes” like “our brand vs. bad brands.” The attributes must represent true spectrums (running from “low” to “high”) that matter to the customer.
Step 3: Choose Competitors
Define a realistic competitive set. This should include your direct competitors, adjacent players, and potential substitute products that your customers might turn to.
Step 4: Gather Perception Data
Conduct market research to gather quantitative and qualitative data. For B2B brands, a sample size of 50 to 100 respondents is a practical floor for perception surveys. You can use customer surveys, focus groups, or modern digital scraping techniques to find out how people rank each competitor on your chosen attributes.
Step 5: Plot Coordinates and Analyze Gaps
Calculate the average scores for each brand and plot them on your intersecting axes. Once plotted, analyze the four quadrants. Look for crowded areas (which indicate high competition) and empty “white spaces.”
Remember: an empty quadrant is only an opportunity if there is actual customer demand for that specific combination of attributes. If you find a gap for “high-price, low-quality” products, it’s empty for a reason!
For a deeper dive into analyzing your market competitors visually, check out our article on Surveying the Field with a Competitive Landscape Map.
Choosing the Right Perceptual Map Templates and Tools
Depending on your budget, timeline, and technical expertise, there are several methods and tools available to build your perceptual maps:
- Collaborative Digital Whiteboards: If you are brainstorming with a cross-functional team, cloud-based diagramming tools are fantastic. You can jump-start your design with a pre-made Perceptual Map Maker | Perceptual Map Creator | Creately template, which allows you to drag, drop, and collaborate in real-time.
- Principal Component Analysis (PCA) Tools: For a more mathematical approach, you can use the Perceptual Mapping Tool by 1749.io. This tool uses PCA to analyze how multiple variables correlate, plotting them as directional arrows where the length of the arrow represents the magnitude of the attribute’s influence.
- Advanced MDS Software: If you are dealing with complex, multi-dimensional datasets (up to 1,000 objects and 30 attributes), you can use dedicated academic freeware like PERMAP: Perceptual Mapping Software. This software is highly interactive and specifically designed to expose “local minima” errors—suboptimal mathematical solutions that standard static charting tools often miss.
- Automated NLP and Text Mining: Modern machine learning allows us to bypass slow, expensive consumer surveys entirely. Researchers have developed methods for Mining perceptual maps from consumer reviews. By extracting nouns and noun phrases from thousands of online reviews (such as Amazon or specialized forums) and running sentiment analysis, algorithms can automatically plot highly accurate, real-time perceptual maps without human bias.
Frequently Asked Questions
What is the difference between a perception map and a position map?
While these terms are often used interchangeably, a perception map (perceptual map) strictly measures customer feelings, beliefs, and subjective ratings of a brand. A position map (or positioning map) is broader and often reflects the company’s strategic intent, showing where the business wants to position its actual product features and pricing in the marketplace.
How Often Should You Update Your Positioning Charts?
At a minimum, we recommend updating your perceptual maps once a year. However, you should also update them immediately following major market events, such as a major competitor launching a new product, significant pricing changes in your industry, or after you run a large-scale brand repositioning campaign.
What Are the Main Limitations of Traditional Mapping?
Traditional 2D perceptual maps are limited to displaying only two variables at a time, which can oversimplify complex purchasing decisions. They are also highly dependent on the quality of your survey data; if your questions are biased or your sample size is too small, the map will reflect those errors. To overcome the two-variable limit, some marketers use spidergrams or multi-dimensional radar charts alongside their maps.
Conclusion
A perceptual map is one of the most powerful tools a business has to step into their customers’ shoes, correct internal biases, and find highly profitable market opportunities. But a map is only useful if you use it to navigate. Once you identify a gap in your market, you must align your entire business strategy—including your product development, customer service, and digital marketing—to claim that space.
At Clayton Johnson, we are an SEO and strategic content agency that helps companies map, understand, and capture their target audiences. We use deep competitive insights and search data to build content strategies that position your brand exactly where your customers are looking.
If you are ready to stop guessing and start dominating your search market, read our guide Competitive Positioning Map Demystified or reach out to us today to see how we can align your brand’s digital presence with your strategic positioning goals.