Why Smart Brands Create a Positioning Map Online Before Making Any Strategic Move
The ability to create a positioning map online has become one of the fastest ways for small business owners to see exactly where they stand in a crowded market — and where the real opportunities are hiding.
Here are the best ways to create a positioning map online right now:
- Use a free interactive builder — tools like NATI Marketing’s Positioning Map Builder let you enter competitor names, assign scores on two axes, and generate a chart instantly
- Start with a collaborative whiteboard template — platforms like Miro (100M+ users), Creately (500,000+ users), and FigJam offer ready-made perceptual map templates you can customize and share
- Try an AI-powered generator — tools like MyMap.AI or ChatDiagram let you describe your market in plain language and auto-generate a professional map in seconds
- Build one manually in a drag-and-drop canvas — choose your X and Y axes, plot 4–8 competitors, and identify any open whitespace
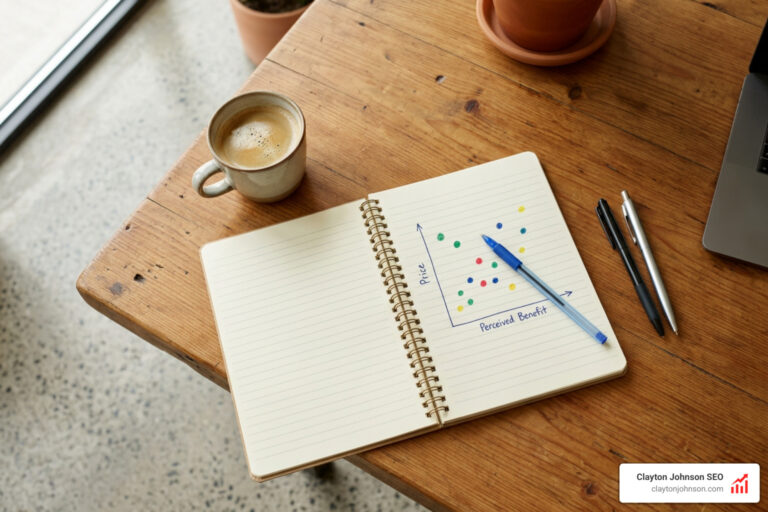
Think of a positioning map as a simple two-axis grid. One concept goes on the horizontal axis, one on the vertical — say, price vs. quality, or ease of use vs. feature depth. You then plot your competitors across the grid. The empty spaces? Those are your opportunities.
Businesses use these maps to spot gaps in the market, sharpen their messaging, guide product decisions, and build more targeted campaigns. The whole process can take less than 30 minutes online.
At Clayton Johnson SEO, I’ve spent over a decade helping small businesses turn competitive research — including the kind of market analysis that goes into positioning maps — into real visibility and revenue online. My work at the intersection of brand strategy and SEO makes understanding how to create a positioning map online a core part of how I help businesses stand out from their competitors.
Understanding the Value of Perceptual and Brand Positioning Maps
To build a truly authoritative brand, we must understand how our target audience perceives us. This is where a perceptual map or brand positioning map becomes indispensable.
At its core, a perceptual map is a visual representation of how consumers view different brands, products, or services relative to their competitors. Rather than relying on internal guesses or pure feature tables, it maps the subjective customer perception. This is vital because, in marketing, perception is reality. If customers perceive your brand as “high cost but low quality,” that is the hurdle you must overcome, regardless of what your product specs claim.
By visualising these consumer perceptions, we can instantly spot market gaps—the “whitespace” where customer needs are currently unmet by existing players. Finding these gaps allows us to carve out a unique space, which is the foundation of any successful Brand Positioning 101 strategy.
Using a positioning map online helps marketing teams align on strategic directions. It strips away the noise of complex spreadsheets and replaces them with a clear, visual 2×2 grid. This clarity is essential when designing a comprehensive roadmap, as outlined in The Definitive Guide to Competitive Positioning. When we can see the entire competitive landscape on a single screen, we can make faster, more objective decisions about where to steer our brand.
How to Create a Positioning Map Online: A Step-by-Step Guide
Building a positioning map does not require advanced design skills or complex statistical software. In 2026, the process is streamlined and highly collaborative thanks to modern online tools.
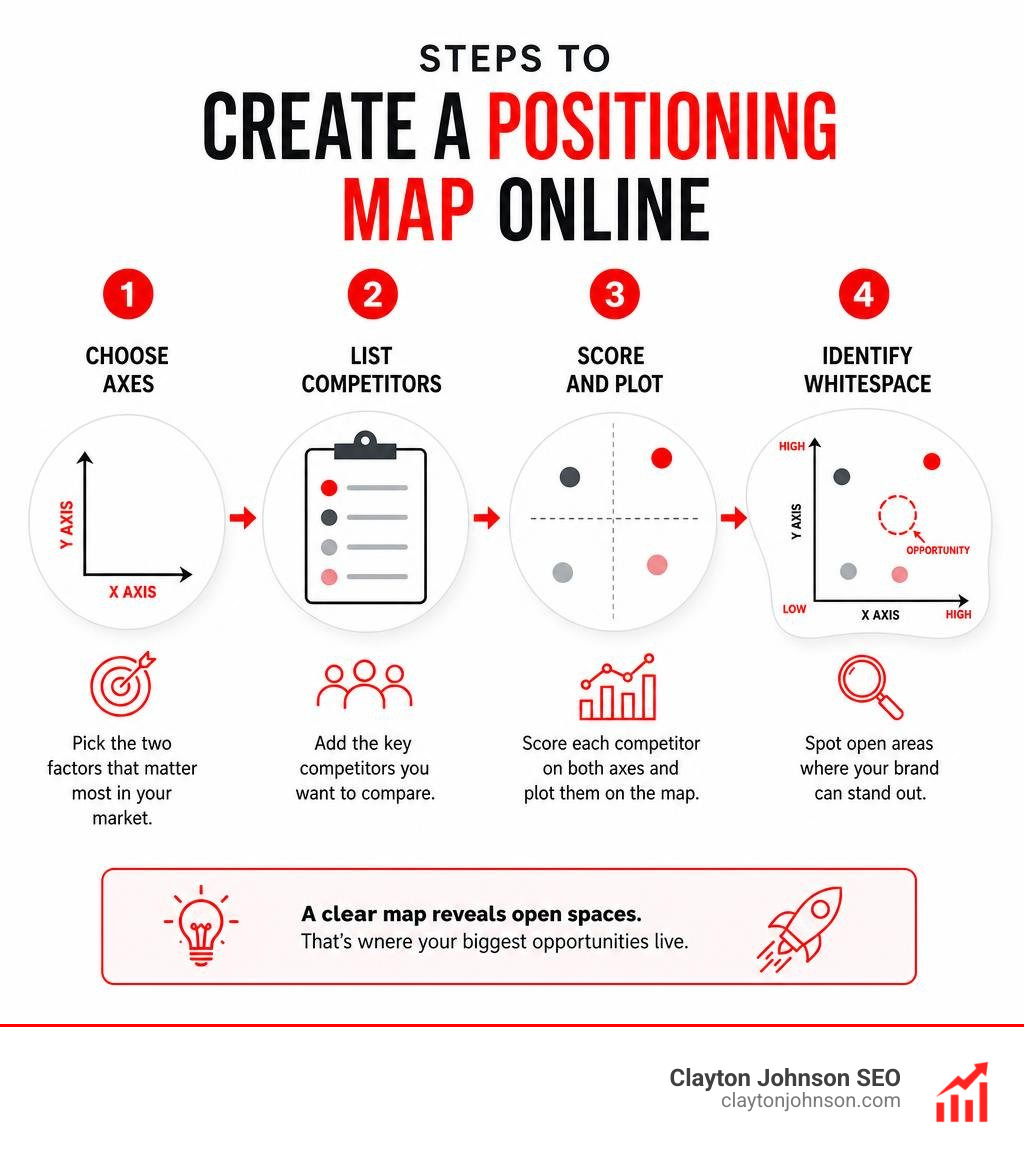
To help your team get started, here is the high-level workflow of how to build and execute a positioning map online:
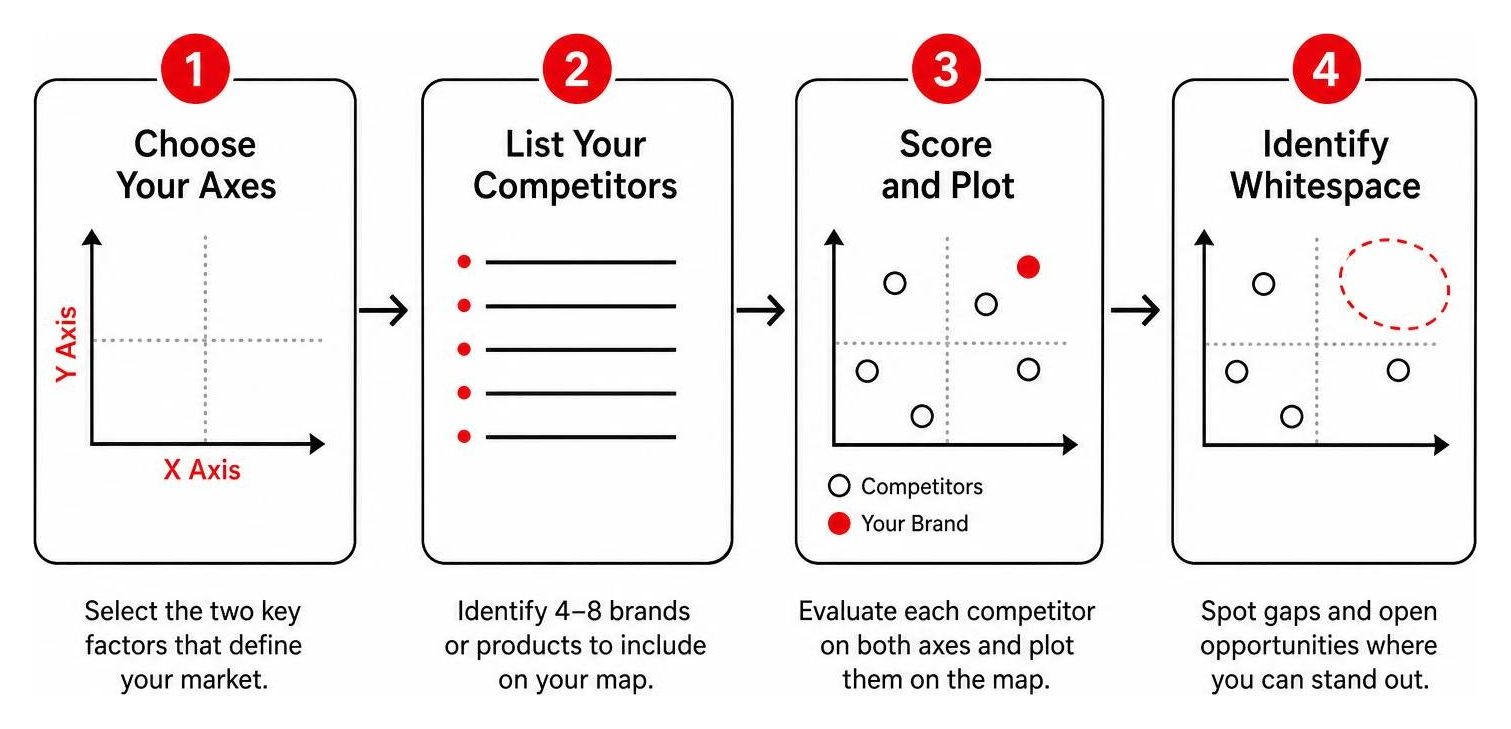
For a deeper dive into how this visual exercise fits into your broader business blueprint, check out our Market Positioning Strategy Complete Guide.
Step 1: Choose the Right Axes to Create a Positioning Map Online
The most critical part of the entire mapping process is selecting the attributes that define your X and Y axes. If you choose the wrong dimensions, your map will yield predictable, unhelpful insights.
To choose the right parameters, we must follow three golden rules:
- Rule 1: Choose dimensions buyers actually care about. Your axes must represent the key criteria that drive purchase decisions in your industry. For an apparel brand, this might be design aesthetic vs. price. For a cybersecurity tool, it might be ease of deployment vs. threat detection depth.
- Rule 2: Avoid correlated dimensions. If you put “Price” on one axis and “Quality” on the other, you will likely end up with a predictable diagonal line (low price/low quality to high price/high quality). Instead, pair non-correlated dimensions like customizability vs. speed, or lifestyle-focused vs. purely functional.
- Rule 3: Make it debatable. Good axes generate healthy strategic debate. If everyone instantly agrees on where every competitor sits without any discussion, your parameters might be too generic.
To help you brainstorm, consider these common positioning parameters across different business models:
- B2B SaaS / Tech: Ease of use vs. Feature depth; Self-serve vs. Enterprise sales-led; Opinionated setup vs. Complete flexibility; Vertical-specific vs. Horizontal platform.
- E-commerce & Retail: Functional vs. Lifestyle/Status; Budget-friendly vs. Premium luxury; Mass production vs. Small-batch artisan.
- Professional Services: Niche specialist vs. Full-service agency; High-touch/Bespoke vs. Standardized/Productized.
For a comprehensive look at how to structure these parameters, refer to The Ultimate Guide to Market Positioning Models.
Step 2: Plot Competitors and Identify Market Gaps
Once your axes are set, it is time to map the competitive field. We recommend selecting 4 to 8 key competitors. Including fewer than four does not provide enough market context, while mapping more than eight can quickly clutter the diagram and dilute your focus.
Start by building brief competitor profiles. Gather data on their pricing, core messaging, target demographics, and primary customer complaints.
Next, place each competitor on the 2×2 grid based on how buyers actually perceive them—not how the competitors claim to be positioned on their homepages. To keep things objective, ask different team members (such as a product marketer, a sales representative, and a customer support lead) to plot the competitors independently, then average their scores.
Once the competitors are plotted, step back and look at the grid. The areas with a dense cluster of logos represent highly contested market segments where it is incredibly difficult to stand out. The empty quadrants represent whitespace opportunities.
Finding these gaps is the first step toward building a brand that refuses to blend in. For a step-by-step methodology on how to transition from mapping whitespace to executing a distinct brand launch, read our guide on Stop Blending In: A Guide to Developing and Establishing a Brand Positioning.
Top Online Tools and Templates for Perceptual Mapping in 2026
When you want to create a positioning map online, you have access to a wide variety of platforms. The right tool depends on whether you want instant AI generation, a simple interactive chart, or an infinite canvas for real-time team brainstorming.
| Tool Name | Best For | Key Features | Pricing Model |
|---|---|---|---|
| NATI Marketing Builder | Quick, simple charts | Interactive sliders, instant PNG download, zero learning curve | Free |
| Creately | Multi-perspective planning | Infinite canvas, links notes to shapes, converts maps to Kanban | Free plan; Paid from $5/mo |
| MyMap.AI | AI-assisted generation | Chat-to-diagram interface, automatic positioning, PNG export | Free daily credits; Paid plans |
| Flares Template | Competitive intelligence | Drag-and-drop, interactive sliders, non-correlated axis presets | Free template; 14-day trial |
| RationalGo Builder | Startup pitch decks | AI-generated positioning narratives, competitor profile cards | Free tier available |
| ChatDiagram | Zero-signup AI creation | Natural language input, fast iterative updates, multiple exports | Free |
Interactive Builders and AI Map Creators
If you want to generate a clean, presentation-ready visual in under five minutes, interactive builders and AI tools are your best option.
- Positioning Map Builder – NATI marketing : This is a straightforward, interactive web tool. You simply input up to five brand names, define your X and Y axes, assign a score from 1 to 10 for each brand, and hit generate. It instantly creates a clean, visual chart that you can download and drop into a slide deck.
- Free AI Perceptual Map Creator | Visualize Brand Positioning : ChatDiagram allows you to create perceptual maps without any manual drag-and-drop. You can describe your industry, competitors, and axes in plain English, and the AI will automatically generate a polished diagram. It requires zero signup and is loved by over 500,000 users worldwide for fast, iterative brainstorming.
- Free AI Magic Quadrant Maker: Create in Minutes : If you want to build a Gartner-style competitive matrix, MyMap.AI uses conversational AI to construct Magic Quadrants. You can import spreadsheets, competitor websites, or raw notes, and the AI assistant will position the companies on the grid. You can refine the placement or colors using simple chat commands and export the final high-resolution PNG.
Collaborative Whiteboards and Dedicated Templates
For teams that want to turn positioning mapping into an interactive workshop, collaborative whiteboard platforms and intelligence templates offer the depth you need.
- Perceptual Map Maker | Perceptual Map Creator | Creately : Serving over 500,000 users globally, Creately provides a highly flexible visual workspace. You can start with ready-made perceptual map templates and customize the shapes, colors, and scales. What makes Creately unique is its “model objects”—you can attach detailed notes, links, and documents to competitor logos, and even transform your positioning map into a product roadmap or Kanban board within the same workspace.
- Positioning Map Template — Free Tool | Flares : Flares offers a dedicated competitive intelligence template designed to strip away the noise. It focuses on helping you select buyer-centric, non-correlated criteria and allows you to drag and drop competitors across the grid. It is an excellent tool for preparing branded, publication-quality positioning slides for sales decks or executive presentations.
- Startup Competitive Positioning Map Builder | RationalGo App Builder | RationalGo : Tailored specifically for startups raising capital, this tool helps you map your market and automatically generates a compelling differentiation narrative for your investor pitch deck. Each competitor on the map features a profile card detailing their estimated market share, funding, and key weaknesses.
Strategic Interpretation and Frequently Asked Questions
Creating the map is only half the battle. The real value lies in how you interpret the visual data to make smarter business moves.
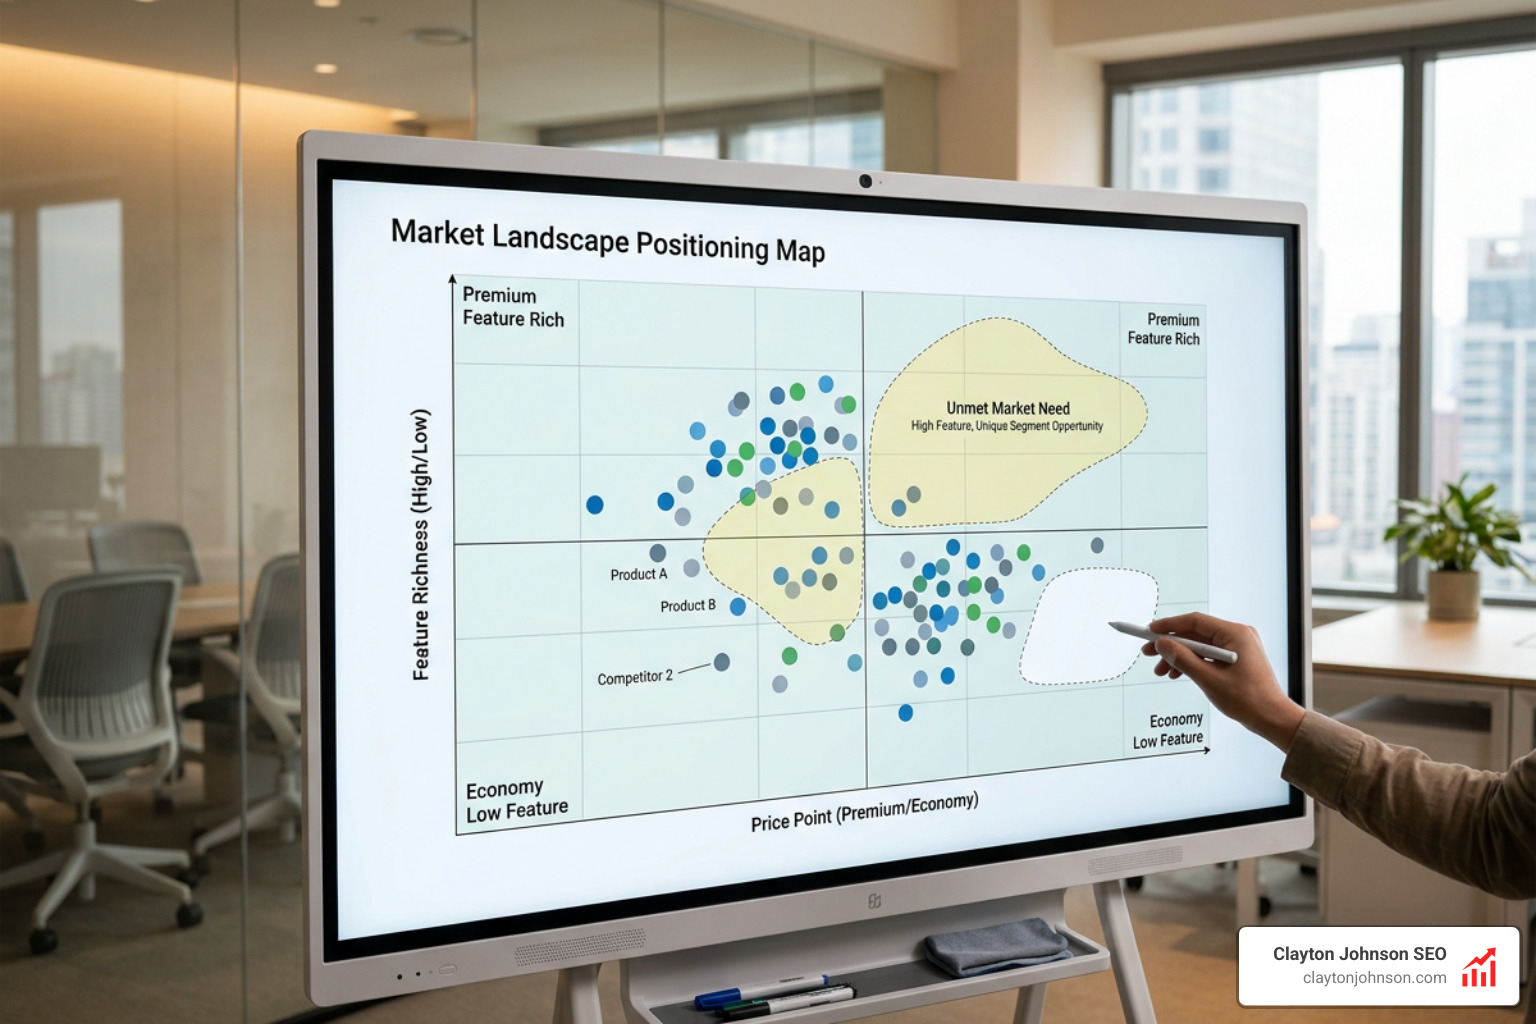
When analyzing your completed map, look for the areas of high density and the areas of absolute emptiness. For a masterclass on how to turn these visual gaps into a concrete narrative that wins customers, read our breakdown on how to Stop Blending In and Start Positioning Like April Dunford.
How to Interpret Your Completed Map
To translate your online positioning map into actionable business growth, ask yourself these key questions:
- Is the whitespace a trap or an opportunity? An empty quadrant on your map does not automatically mean you should target it. Sometimes, a quadrant is empty because there is no customer demand or because it is economically unfeasible to serve. Validate the whitespace by talking to buyers.
- Are we where we think we are? Compare your internal team’s map with actual customer survey data. If your team plotted your brand as “high value,” but customers perceive you as “average,” you have a messaging gap.
- Can we defend our position? If you decide to move your brand into an open whitespace quadrant, consider how easy it will be for a well-funded competitor to copy your move.
To learn more about developing a defensible market position, read about The Art of Being Different and Better.
Common Pitfalls to Avoid When You Create a Positioning Map Online
- Biased Self-Placement: It is incredibly easy to fall into the trap of placing your own company in the perfect upper-right quadrant of every map. Be brutally honest, and back up your placements with real win/loss sales data or customer interviews.
- Using Correlated Axes: As mentioned, avoid pairing attributes like “Price” and “Quality” or “Speed” and “Efficiency.” This results in a diagonal cluster that offers no strategic insight.
- Treating the Map as Permanent: Markets shift rapidly. Competitors release new features, drop their prices, or rebrand entirely. Treat your map as a living document.
- Ignoring the Buyer’s Voice: Never build a positioning map based entirely on what your executive team thinks. If you do not validate your axes and placements with buyer feedback, your map is just an expensive guess.
For a complete guide on how to avoid these traps and communicate your final positioning to your market, see Positioning Strategy from Development to Communication.
What is the difference between a perception map, a position map, and a competitive matrix?
While these terms are often used interchangeably in marketing discussions, they serve distinct strategic purposes:
- Perception Map (or Perceptual Map): Focuses entirely on the customer’s subjective views. It is built using consumer survey data, reviews, and market research to show how buyers perceive competing brands.
- Position Map: Focuses on strategic intent. It plots where companies actively position themselves in the market through their pricing, messaging, and feature sets.
- Competitive Matrix: A detailed feature-by-feature comparison table. It is highly objective and lists specific technical capabilities, integrations, and pricing tiers rather than plotting broad market perceptions on a grid.
How many competitors should be included on a positioning map?
For the best strategic clarity, aim for 4 to 8 competitors. Including fewer than four does not provide enough market context to spot real patterns. Including more than eight to ten competitors clutters the grid, making it difficult for stakeholders to read. If you operate in a highly fragmented market with dozens of competitors, group similar competitors into “clusters” or build multiple, segment-specific maps.
How often should a company update its positioning map?
We recommend updating your positioning map quarterly. At a minimum, you should review and refresh the map once a year, or immediately following major market events—such as a competitor raising a major funding round, launching a disruptive new product, or undergoing a major rebrand.
Conclusion
When you create a positioning map online, you strip away the guesswork and replace it with visual clarity. By selecting the right buyer-centric axes, plotting your competitors objectively, and identifying open whitespace, you can position your brand to stand out rather than blend in.

At Clayton Johnson SEO, we help companies align their brand positioning with high-impact, strategic search engine optimization. By understanding exactly who your target audience is and how they perceive the market, we design content and SEO strategies that capture high-intent search traffic and drive real business growth.
Ready to unlock your brand’s true competitive edge? Explore our complete breakdown on Competitive Positioning Map Demystified to turn your market insights into search engine dominance.