What Is Competitive Supply Analysis (And Why It Matters for Your Business)
Competitive supply analysis is the process of examining how your competitors source, produce, and deliver value — so you can find gaps, reduce costs, and build a lasting advantage.
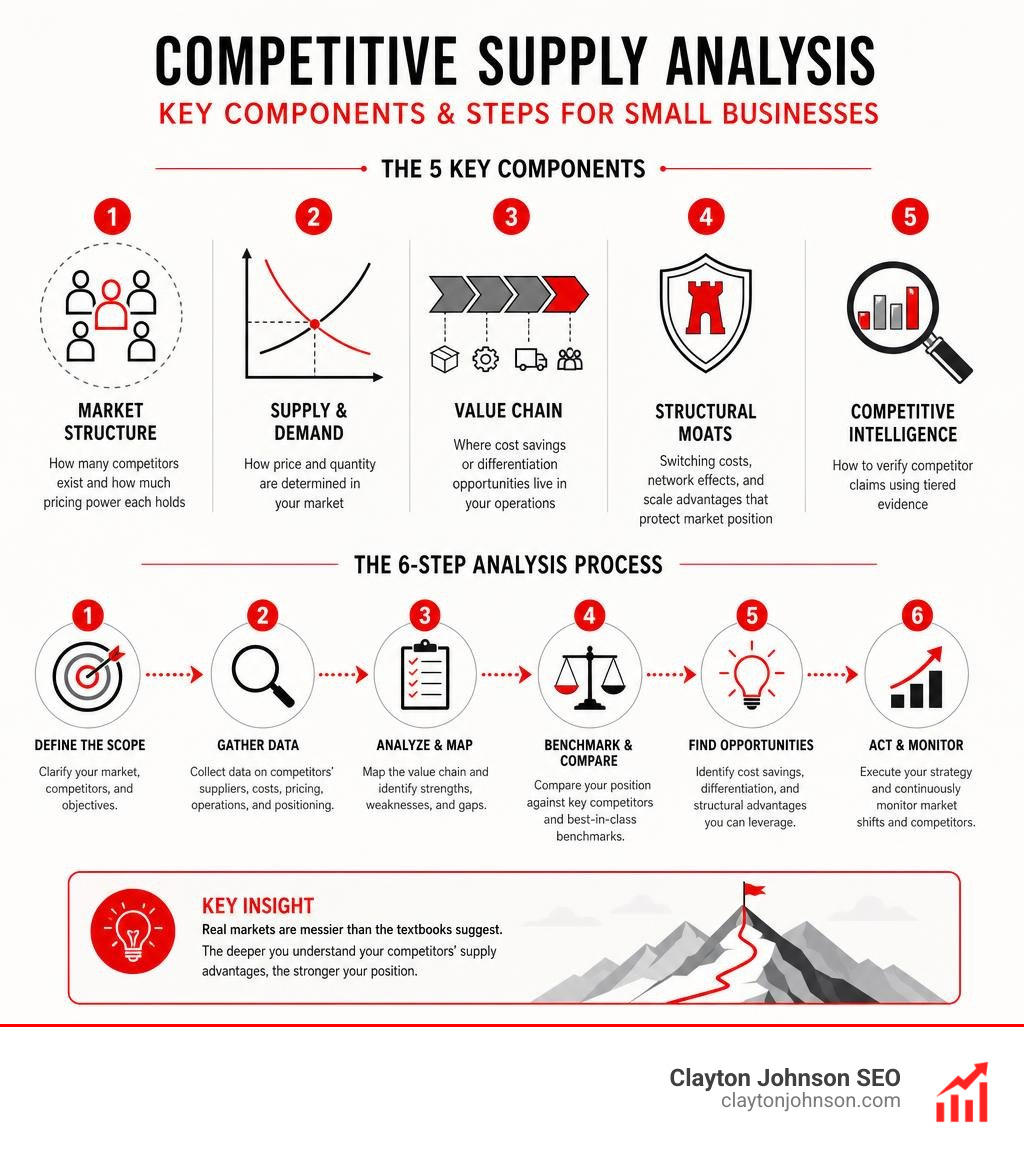
Here is a quick overview of what it covers:
| Component | What It Examines |
|---|---|
| Market structure | How many competitors exist and how much pricing power each holds |
| Supply and demand | How price and quantity are determined in your market |
| Value chain | Where cost savings or differentiation opportunities live in your operations |
| Structural moats | Switching costs, network effects, and scale advantages that protect market position |
| Competitive intelligence | How to verify competitor claims using tiered evidence |
Most business owners think about competition in terms of price. Who is cheaper? Who has a better product?
But price is just the surface.
The real question is why some competitors can offer lower prices, faster delivery, or better margins — and sustain it. The answer almost always lives deeper in the supply chain.
Consider this: even in markets that appear highly competitive, prices do not behave the way economic theory predicts. A study of the Fulton Fish Market — with 35 dealers operating in close proximity selling identical fish — found that Asian buyers paid roughly 7% less per pound than white buyers for the same product. In a perfectly competitive market, that gap should not exist. But it did.
That is the core insight behind competitive supply analysis. Real markets are messier than the textbooks suggest. And that messiness creates both risks and opportunities for small business owners who know where to look.
At Clayton Johnson SEO, we specialize in helping small businesses cut through market complexity using data-driven strategy — including competitive supply analysis frameworks that reveal where your competitors are strong, where they are vulnerable, and what it will take to outposition them. Our work combines search intelligence, content strategy, and structured competitive research to give business owners the clarity they need to compete smarter.
Theoretical Foundations: Perfect Competition vs. Real-World Markets
To master competitive supply analysis, we must first look at the benchmark economists use to define a highly competitive landscape: the model of perfect competition.
In a perfectly competitive market, individual firms have zero market power. They are price takers, meaning they must accept whatever price the broader market dictates. This happens because the market is flooded with many buyers and sellers, all trading completely identical (homogeneous) products.
But as any business owner operating in July 2026 knows, the real world rarely plays by these textbook rules. Most markets are defined by product differentiation, where companies use branding, unique features, or customer service to escape the trap of commodity pricing. By differentiating, a business gains some degree of market power—the ability to raise prices without losing all of its customers. Understanding where your market sits on this spectrum is the first step in crafting a viable strategy. For a deeper look at aligning your business with these market dynamics, check out our More info about competitive positioning.

The Mechanics of Competitive Equilibrium and the Law of One Price
Under ideal theoretical conditions, competitive markets naturally achieve competitive equilibrium. This is the point where the market clears—meaning the total quantity demanded by buyers exactly matches the total quantity supplied by sellers.
At this equilibrium point, a fundamental economic principle known as the Law of One Price should theoretically hold true. This law states that in an efficient market, identical goods must trade at the exact same price.
We see the closest real-world approximations of this in agricultural products like wheat, rice, coffee, and tomatoes. In these commodity markets, products are highly homogeneous, and buyers can easily compare prices. If one wheat farmer tries to charge a premium, buyers will simply walk next door. To see how researchers map these dynamics systematically, you can explore this Research on competitive market analysis.
Why Real-World Markets Violate Perfect Competition
While perfect competition is a useful mathematical benchmark, real-world markets routinely violate its core assumptions. This happens because of several persistent market frictions:
- Search Costs and Information Asymmetry: Buyers do not have infinite time or perfect information. They rarely search every single vendor to find the absolute lowest price.
- Price Dispersion: Because of search costs, the exact same product can sell for wildly different prices at the same time. For example, BoardGamePrices data from May 2022 showed that retail prices for the classic Monopoly board game ranged from £20.59 to £37.20 across UK online retailers—an 81% price differential for an identical, mass-produced product!
- Cartels and Collusion: Sometimes, competitors actively work together to break the system. In 2014, major chocolate bar producers were accused of colluding to keep prices artificially high, demonstrating how easily markets with differentiated products fail to meet competitive equilibrium conditions.
- Lack of Arbitrage: In the famous Fulton Fish Market study, researcher Kathryn Graddy analyzed 3,357 sales transactions of whiting fish. Despite 35 dealers operating in close physical proximity, prices varied significantly. Buyers did not aggressively search for better deals, and new dealers did not enter the market to capture those economic rents, completely contradicting the Law of One Price.
Frictions like these are not just theoretical anomalies; they represent the exact areas where your business can carve out a profitable niche. If you want to understand how these market pressures force businesses to adapt, read our guide on More info on competitive pressure.
Microeconomics of the Firm: Supply Curves and Pricing Decisions
To analyze how your competitors make pricing and output decisions, we have to look at the microeconomics of the individual firm.
In a perfectly competitive market, there is a fascinating paradox: the overall market demand curve slopes downward (as prices drop, total market demand increases), but the demand curve facing an individual firm is infinitely elastic, represented as a perfectly horizontal line at the market-clearing price.
This horizontal demand curve exists because the individual firm is so small relative to the market that its output decisions have zero impact on the market price. If the firm raises its price by even one penny, sales drop to zero. If it lowers its price, it needlessly sacrifices revenue because it can already sell all of its output at the market price. For a visual guide on mapping out where your competitors sit in this landscape, refer to More info on competitive landscape mapping.
Why Individual Demand is Infinitely Elastic in a Competitive Market
The infinite elasticity of individual demand relies on three strict conditions:
- Homogeneous Goods: The products sold by all firms are perfect substitutes.
- Perfect Price Awareness: Buyers immediately know if a seller changes their price.
- No Transaction Costs: Buyers can switch sellers instantly and costlessly.
Because of this horizontal demand curve, a competitive firm’s marginal revenue (the additional revenue earned from selling one more unit) is always equal to the market price ($MR = P$).
Deriving the Firm’s Supply Curve from Marginal Cost
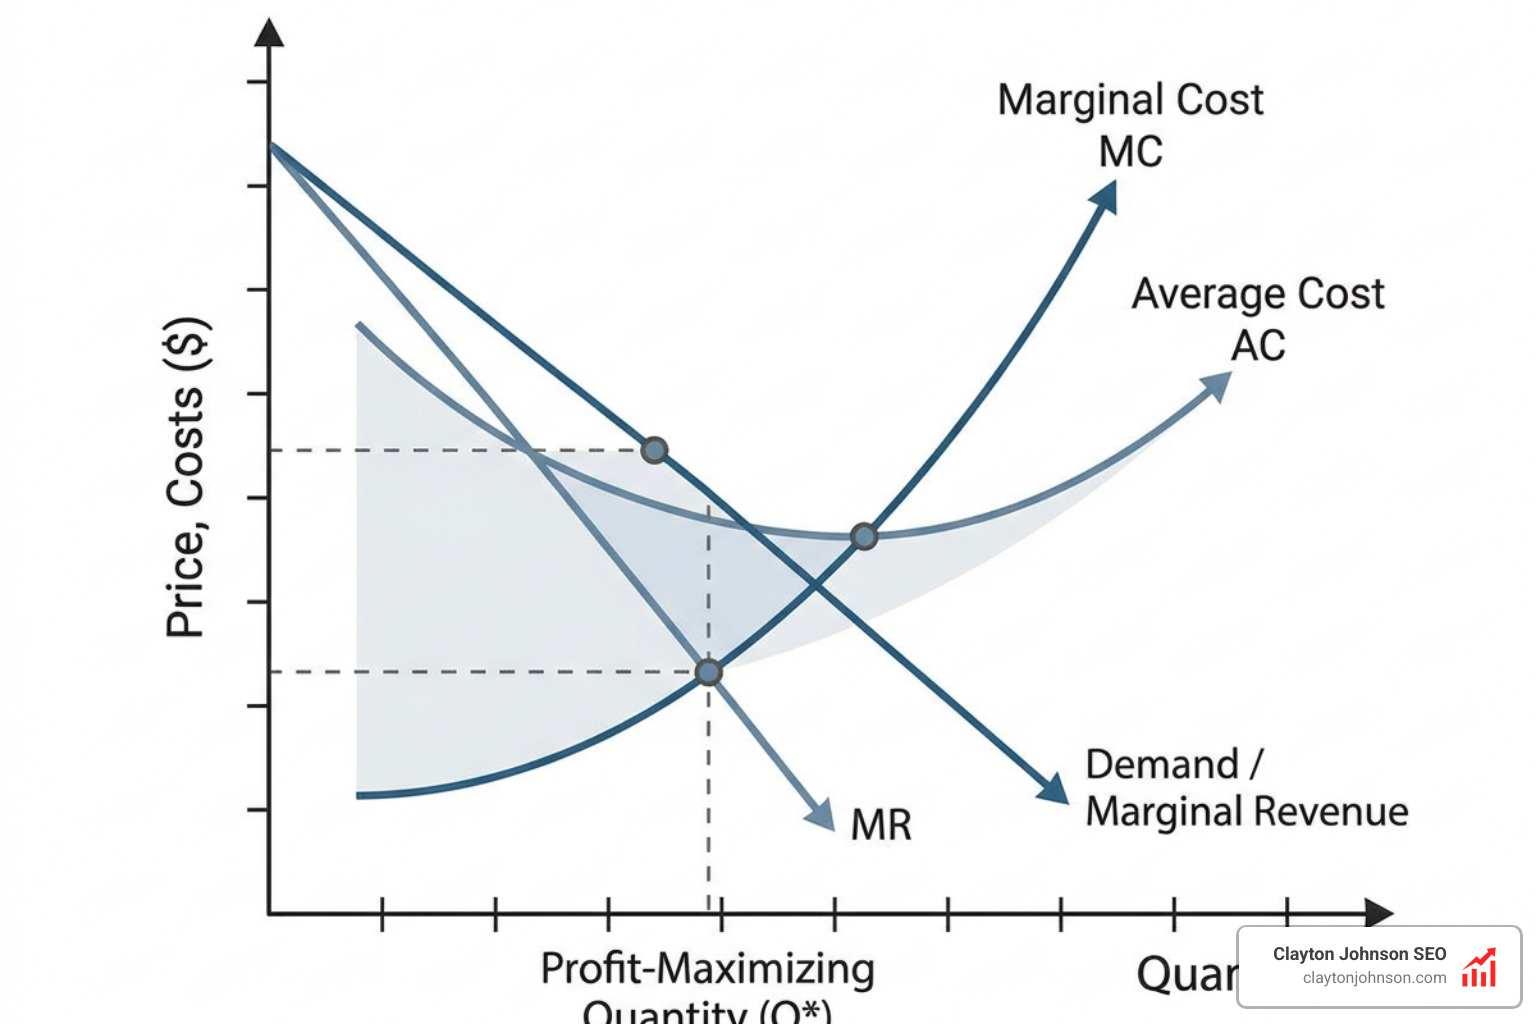
So, how does a competitive firm decide how much to produce? It uses a simple rule: produce at the level where Marginal Cost (MC) equals Price (P).
Marginal cost is the cost of producing one additional unit of output. As long as the market price is higher than the marginal cost of making the next unit, the firm will increase its profits by producing and selling that unit. The profit-maximizing output level is reached exactly where the rising marginal cost curve intersects the horizontal price line.
Because the firm always chooses its production quantity by matching price to its marginal cost, a competitive firm’s individual supply curve is identical to its marginal cost curve (above its average variable cost).
Understanding these cost curves is highly practical. For instance, in heavy industries like chemicals, analysts use specialized benchmarking tools to map out global production capacities. To see how this works in practice, look at this Scientific research on chemical cost curves.
Executing a Competitive Supply Analysis in the Value Chain
To find a competitive edge that goes beyond basic pricing theory, we must look inside the firm using Michael Porter’s Value Chain framework.
The value chain breaks a business down into its strategically relevant activities to understand where costs accumulate and where differentiation can be built. These activities are split into Primary Activities (such as inbound logistics, operations, outbound logistics, marketing, and service) and Support Activities (like procurement, technology development, human resource management, and infrastructure).

By analyzing these activities, we can determine whether a competitor’s advantage is driven by superior logistics, proprietary technology, or better purchasing power. To see how these forces shape overall industry attractiveness, check out More info on Porter’s Five Forces.
Applying Competitive Supply Analysis to Value Chain Mapping
A thorough competitive supply analysis maps out how competitors optimize their value chains to achieve low-price leadership or premium differentiation.
For example, retail giants have historically achieved low-price leadership not just by slashing margins, but through strategic supply chain management—optimizing secondary activities like procurement and logistics to support their primary sales operations.
Furthermore, we can look at how companies leverage the virtual value chain—which focuses on information activities (gathering, organizing, selecting, synthesizing, and distributing data)—to create entirely new business models:
| Value Chain Activity | Physical Value Chain Example | Virtual Value Chain Example |
|---|---|---|
| Inbound Logistics / Data Sourcing | Receiving raw materials at a physical warehouse. | Gathering user search intent and web traffic data. |
| Operations / Processing | Assembling physical components on a factory line. | Synthesizing data points using AI to generate insights. |
| Outbound Logistics / Distribution | Shipping finished products to retail stores. | Delivering real-time digital reports via cloud dashboards. |
| Support / Infrastructure Transformation | Building internal IT servers to host corporate emails. | Commercializing internal cloud tools into public services (e.g., AWS). |
We see this physical-to-virtual transition in companies like FedEx, which dominated shipping by converting its package tracking system (an information activity) into massive customer value. Similarly, Amazon Web Services (AWS) was originally built to support internal e-commerce operations but became a massive primary revenue stream when made available to external customers.
Strategic Responses to Competitors with Structural Advantages
What should we do when a competitor with massive structural advantages—like aggregation power, distribution leverage, or immense scale economies—enters our target market?
We must avoid competing head-to-head on price. Instead, we should deploy defensive and repositioning strategies:
- Focus on a Beachhead Market: Double down on a highly specific, underserved niche where the giant’s generic offering fails to satisfy customer needs.
- Build High-Touch Value: Offer custom services, personalized support, or community-driven features that large, automated platforms cannot easily replicate.
- Leverage Strategic Content: Use search intelligence to map out exactly what your audience is searching for, creating highly targeted content that builds direct relationships with buyers.
To learn how to gather the data needed to make these high-stakes strategic moves, read our guide on More info on competitive intelligence.
Advanced Frameworks for Competitive Supply Analysis
To build a business that can withstand aggressive competitors, we must look at how structural moats are created. A moat is a sustainable, structural barrier that protects a company’s long-term profits from being eroded by competitive forces.
If you are looking for structured models to evaluate your market position, read our breakdown of More info on strategic frameworks.
Evaluating Moats with the 7 Powers and Aggregation Theory
To understand why some markets remain highly competitive while others consolidate into monopolies, we use advanced strategic frameworks like Hamilton Helmer’s 7 Powers, W. Brian Arthur’s work on lock-in, and Clayton Christensen’s disruption model.
Let’s look at how three of these structural powers operate in the supply chain:
- Scale Economies: As production volume increases, the average cost per unit decreases. This gives high-volume incumbents a massive cost advantage that new entrants cannot match without spending billions on infrastructure.
- Network Effects: A service becomes more valuable as more people use it. This creates a powerful winner-take-all dynamic where buyers and suppliers are drawn to the largest platform.
- Counter-Positioning: This occurs when a new entrant adopts a superior, disruptive business model that the incumbent cannot easily copy because doing so would damage their existing, highly profitable business.
When these structural advantages are combined with modern digital platforms, we see the rise of Aggregation Theory. Aggregators win not by controlling supply, but by dominating demand. By providing a superior user experience, they attract millions of consumers, which in turn forces suppliers to operate on the aggregator’s terms, completely reshaping traditional supply chains. To see how these competitive pressures drive industry-wide innovation, read More info on competitive pressure and innovation.
Verifying Intelligence with Evidence Tiers in Competitive Supply Analysis
When conducting a competitive supply analysis, we cannot rely on marketing claims or press releases. We must use a rigorous, tiered evidence framework to distinguish between public relations and verifiable competitive intelligence.
We categorize competitive intelligence into six distinct tiers:
- Tier 1 (T1) – Direct Behavioral Data: Hard, verifiable data of actual competitor or customer actions (e.g., transaction records, credit card data, web traffic logs).
- Tier 2 (T2) – Confirmed Financials & Regulatory Filings: Official documents filed with government bodies (e.g., SEC EDGAR filings, Census Bureau data, BLS wage benchmarks).
- Tier 3 (T3) – Direct Supplier & Partner Interviews: Direct accounts from people operating within the competitor’s supply chain.
- Tier 4 (T4) – Self-Reported Marketing & PR Claims: What the competitor claims they are doing via press releases, social media, and executive interviews.
- Tier 5 (T5) – Secondary Analyst Reports: Third-party market research and industry digests.
- Tier 6 (T6) – Punditry & First-Principles Inference: Educated guesses and logical deductions based on general market trends.
By systematically scoring your competitors’ moats using T1 and T2 data, you can build a highly accurate “Competitive War Map” that guides your strategic decisions.
Frequently Asked Questions about Competitive Supply Analysis
What is the difference between a supply chain and a value chain?
While they are closely related, they have different strategic focuses. A supply chain is focused on the physical logistics—the movement of raw materials, inventory, and finished goods from suppliers to the end consumer. Its primary goals are operational excellence, cost reduction, and speed.
A value chain, on the other hand, is a broader strategic framework. It looks at every activity (both physical and digital) that adds value to the product from the customer’s perspective. The goal of value chain analysis is to identify opportunities for margin expansion and unique differentiation.
Why does the Law of One Price fail in digital markets?
In theory, digital markets should have zero search costs and perfect information, leading to identical pricing. In practice, the Law of One Price fails online due to:
- Brand Loyalty and Trust: Consumers are often willing to pay a premium to buy from a familiar, trusted site rather than an unknown vendor.
- Convenience and Bundling: Subscriptions like Amazon Prime bundle shipping, video, and music, creating high switching costs that deter users from shopping around.
- Algorithmic Pricing: Retailers use dynamic pricing models that change prices in real-time based on user behavior, location, and browsing history, preventing a single market-clearing price from stabilizing.
How do switching costs create a structural moat?
Switching costs are the one-time inconveniences, expenses, or risks a customer faces when moving from your product to a competitor’s. These can be financial (such as contract termination fees), procedural (the time required to learn a new software), or psychological (the fear of a new vendor failing).
When switching costs are high, they act as a powerful contractual and behavioral shield. Even if a competitor enters the market with a slightly cheaper product, customers will stay with you because the cost of making the switch outweighs the marginal savings.
Conclusion
Conducting a thorough competitive supply analysis is the difference between guessing your next business move and executing a highly targeted, data-backed strategy. By understanding the microeconomics of supply, mapping your competitors’ value chains, and verifying your insights with tiered evidence, you can find the structural advantages needed to secure your market position.
At Clayton Johnson SEO, we help businesses map and understand their target audiences through strategic content and SEO services. By combining deep competitive research with search intelligence, we ensure your brand is positioned exactly where your highest-value customers are looking.
If you are ready to stop guessing and start building a sustainable, search-driven advantage, explore our comprehensive guides and resources on More info on competitive analysis. Let’s work together to find your edge in the value chain.