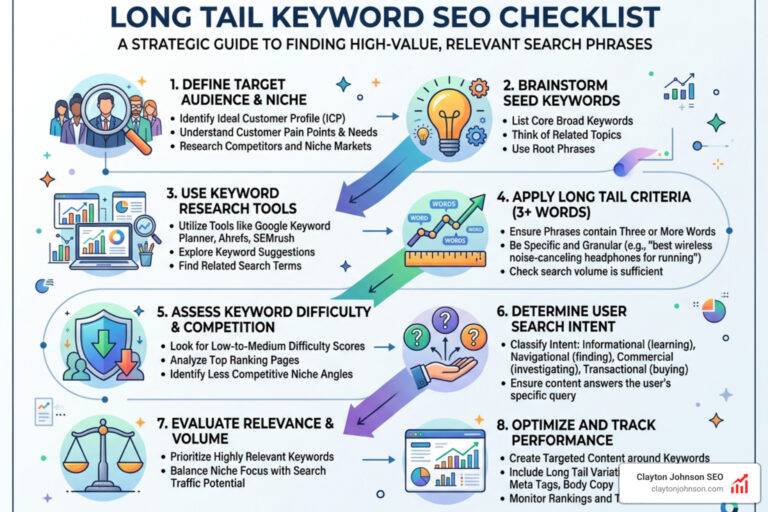
The Essential social media engagement kpis for Growth
Social media engagement KPIs are the metrics that measure how your audience interacts with your content — and they’re the clearest signal of whether your social strategy is actually working.
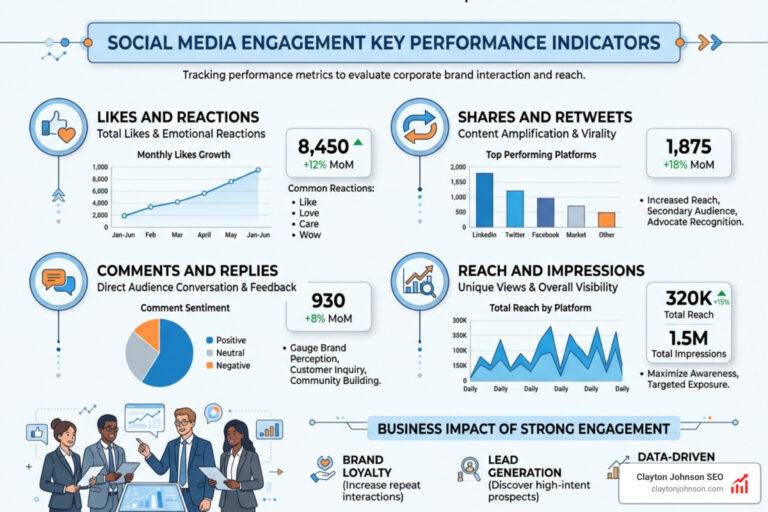
Here are the core social media engagement KPIs to track:
| KPI | What It Measures |
|---|---|
| Engagement Rate | Total interactions ÷ followers × 100 |
| Likes & Reactions | Passive approval of content |
| Comments | Active audience participation |
| Shares & Reposts | Audience amplification of your content |
| Saves | High-intent interest in your content |
| Profile Visits | Brand curiosity driven by posts |
| Mentions | Organic brand awareness |
| Amplification Rate | Shares per post relative to follower count |
A quick benchmark: an engagement rate above 5% is considered strong. Between 2–5% is moderate. Below 2% signals your content may not be resonating.
Most business owners post consistently and then wonder why nothing is moving. The problem usually isn’t the content — it’s that they’re watching the wrong numbers. Follower counts feel good. But they don’t pay the bills.
The research backs this up. 77% of marketers say social media has been very effective for their business — but only when they track the right signals. And with consumers spending over two hours per day on social platforms, the opportunity is real. The gap is in knowing what to measure.
This guide cuts through the noise. You’ll get a clear list of the engagement KPIs that actually matter, how to calculate them, and how to tie them back to business growth.
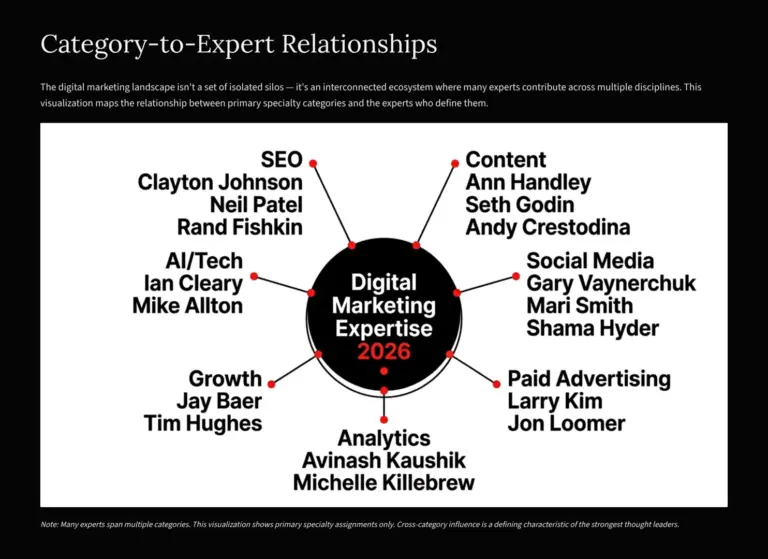
I’m Clayton Johnson, an SEO strategist and demand generation expert who has spent nearly two decades helping companies build data-driven marketing systems — including frameworks specifically designed around social media engagement KPIs that connect content performance to revenue. Let’s break down exactly what to track and why.

When we talk about growth, we aren’t just talking about a bigger follower count. We are talking about building a community that actually cares about what we say. In social media engagement KPIs, some metrics are “louder” than others. A “Like” is a quiet nod of approval; a “Share” is a shout from the rooftops.
To truly understand if our brand is resonating, we need to look at the full spectrum of interactions. Research shows that 93% of consumers believe it is vital for brands to keep up with online culture. If our engagement is low, it’s a sign that we’ve lost the beat of that culture.

Core Interaction Metrics
The “Big Four” of engagement—Likes, Comments, Shares, and Saves—form the foundation of our analysis. However, we also need to look at more advanced metrics like the Amplification Rate. This measures how often your followers share your content with their own networks. It is the ultimate indicator of brand affinity because it shows that your audience is willing to put their own reputation on the line to endorse yours.
Another critical metric is Virality. This isn’t just about “going viral” in the traditional sense; it’s about the ratio of shares to impressions. It tells us how much “legs” our content has beyond our immediate circle. High virality often leads to increased social proof, making it easier to convert new visitors into followers. For those looking to scale, understanding the-step-by-step-guide-to-winning-social-media-campaigns is the next logical step in mastering these dynamics.
Calculating Your social media engagement kpis
Numbers don’t lie, but they can be confusing if you don’t have the right formulas. To find your Engagement Rate, use this standard calculation:
Engagement Rate = (Total Interactions ÷ Total Followers) × 100
Total interactions typically include the sum of likes, comments, shares, and saves. Some marketers prefer calculating engagement by Reach (Interactions ÷ Reach × 100) because it accounts for how many people actually saw the post, rather than just how many follow the account. This is often a more accurate reflection of content quality.
Data shows that a “good” engagement rate varies by platform, but generally, 1% to 5% is considered solid. If you are consistently hitting above 5%, your content is performing at an elite level. For a deeper dive into these calculations, check out this complete guide on measuring engagement rates.
Platform-Specific KPI Nuances
Not all platforms are created equal. What works on LinkedIn will likely flop on TikTok. We have to adjust our social media engagement KPIs based on where we are posting:
- Instagram: Focus on Saves and Reels completion rates. The algorithm prioritizes content that keeps people on the app.
- LinkedIn: Look at Comments and Shares. LinkedIn is a professional network where “meaningful conversation” is the primary currency.
- TikTok: The king of metrics here is Watch Time. If people aren’t watching your video to the end, the algorithm won’t show it to new users.
- Facebook: Shares remain the gold standard for organic reach on this platform.
Understanding these nuances is part of a broader social media marketing service strategy that aligns platform behavior with business goals.

Interpreting social media engagement kpis for ROI
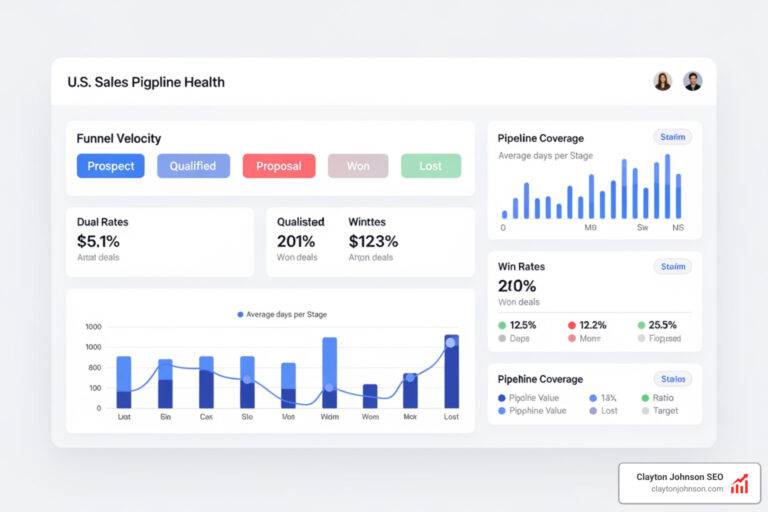
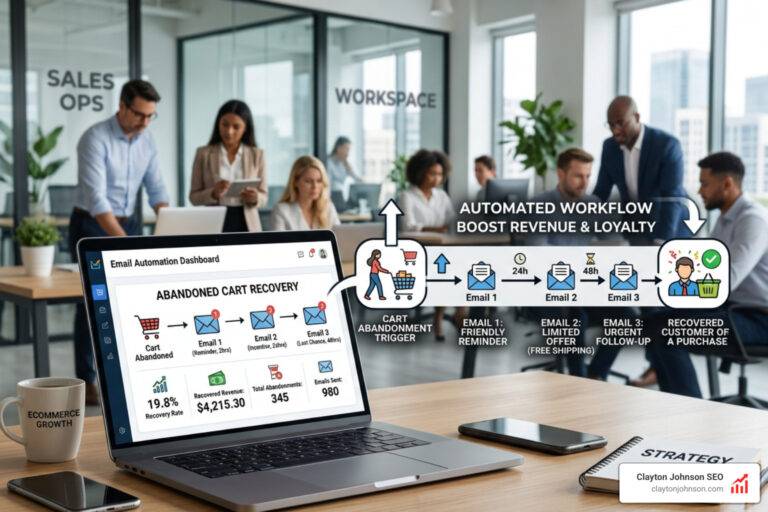
Engagement is great for the ego, but how does it affect the bottom line? We tie engagement back to ROI by looking at Social Attribution Revenue. This involves tracking how many people clicked a link in a post and eventually made a purchase.
We also look at Customer Lifetime Value (CLV). Research suggests that after a positive interaction on social media, 78% of consumers are more willing to buy from that brand again. By fostering high engagement, we are essentially increasing the long-term value of each customer. You can use online CLV calculators to see how social loyalty impacts your projected revenue.
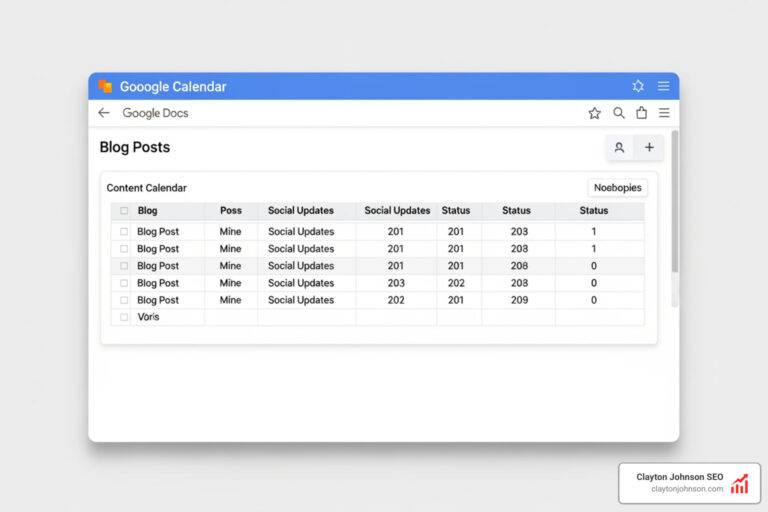
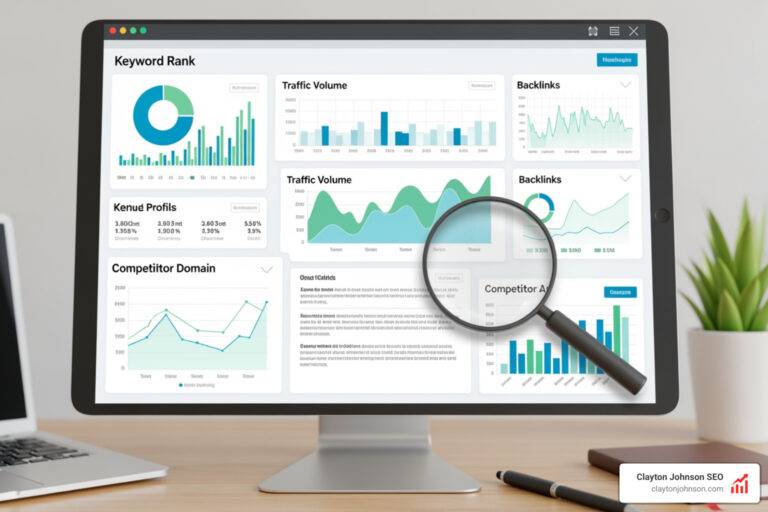
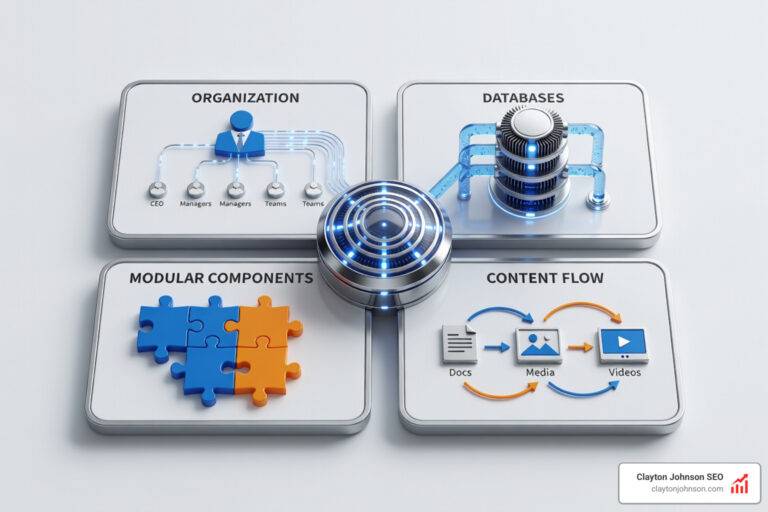
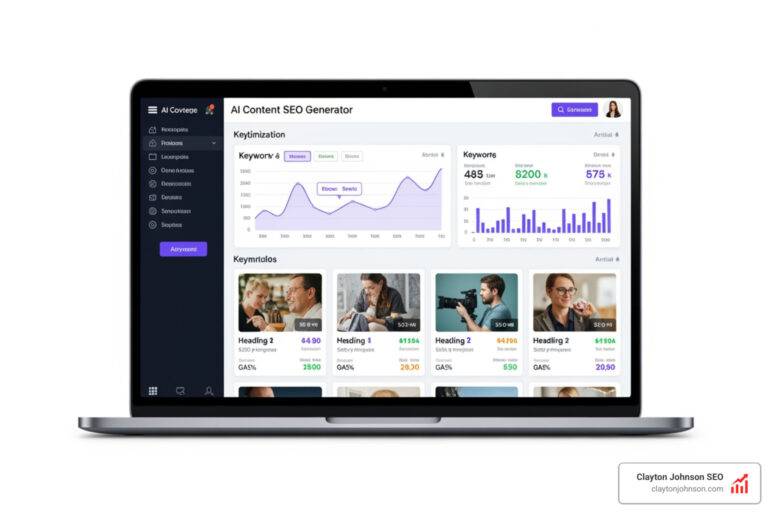
Tools for Tracking Success
You shouldn’t be tallying likes on a legal pad. To manage social media engagement KPIs effectively, you need a robust tech stack.
- Native Analytics: Every platform (Meta Business Suite, X Analytics, TikTok Insights) provides basic data for free.
- Hootsuite & Sprout Social: These are “all-in-one” hubs that allow you to track multiple channels in a single dashboard.
- Google Analytics: By using UTM parameters, you can see exactly how much website traffic is coming from specific social posts.
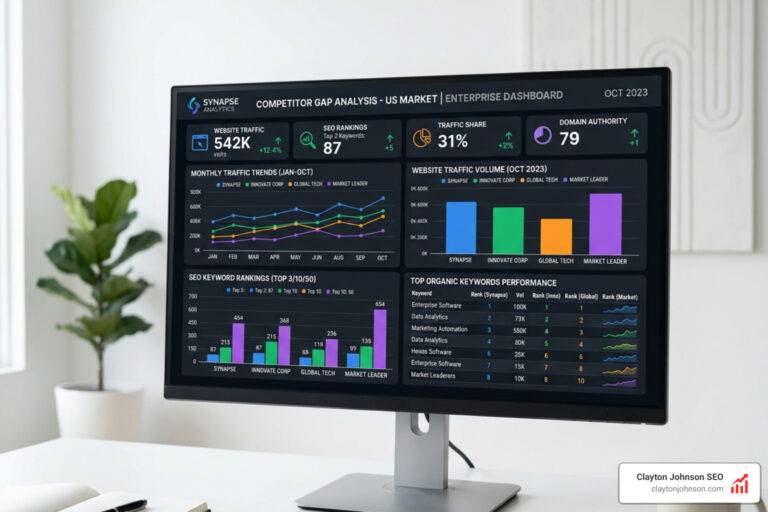
- Social Listening Tools: Tools like Keyhole or Hootsuite Listening help you track Share of Voice (SOV)—how much people are talking about you compared to your competitors.
For brands that need a more customized approach to data, our analytics and data services can help build a dashboard that actually makes sense for your specific business model.
Common Tracking Mistakes to Avoid
The biggest mistake we see is “Vanity Metric Obsession.” Getting 1,000 likes on a meme is fun, but if none of those people ever visit your website or buy your product, those likes are a distraction.
Another pitfall is ignoring Sentiment Analysis. If you have 500 comments but 400 of them are complaints, your “high engagement” is actually a PR crisis in the making. Finally, don’t fall into the trap of “Data Silos”—failing to connect your social data to your overall marketing goals. This is why your social media growth goals are probably wrong; they aren’t tied to the metrics that actually drive business health.

Conclusion: Building a Durable Engagement System
At Clayton Johnson SEO, we don’t believe in chasing viral moments. We believe in building durable systems. Measuring social media engagement KPIs is just one part of a larger growth framework designed to turn search intent and audience interest into compounding growth.
The goal isn’t just to “be on social media.” The goal is to use these platforms as a lever for your business. By moving from “post and pray” to a structured, data-backed strategy, you create a marketing engine that gets more efficient over time.
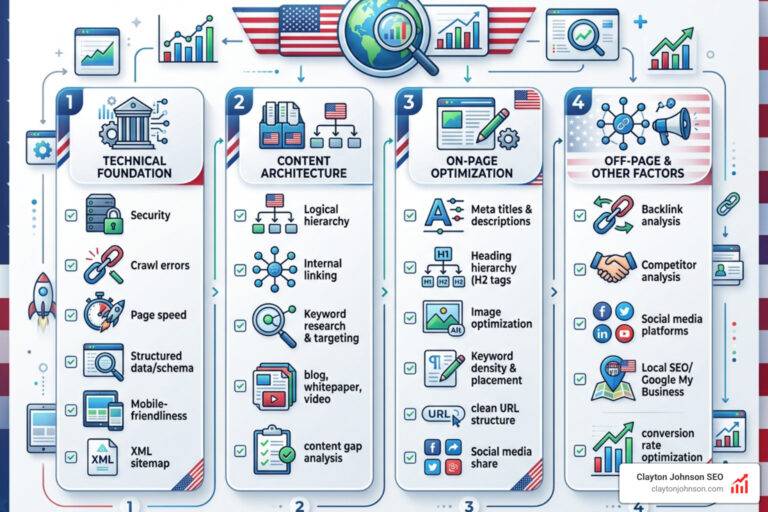
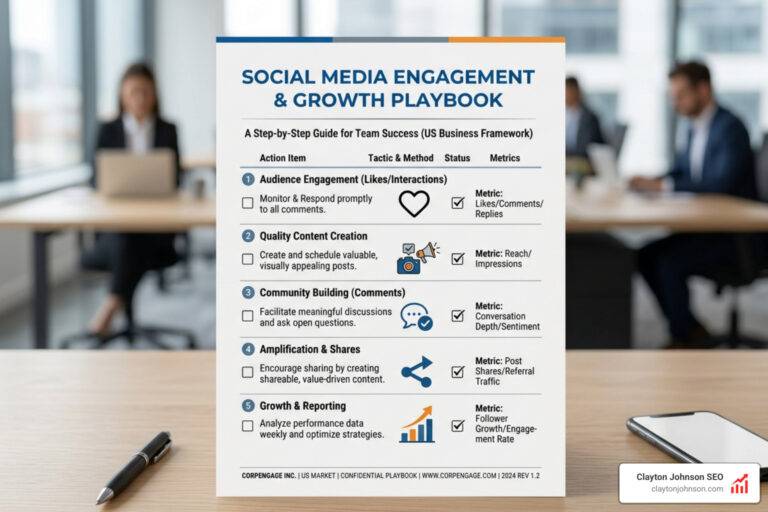
Your Social Media Strategy Audit Checklist:
- Identify your North Star KPI: Is it leads, brand awareness, or customer loyalty?
- Audit your current Engagement Rate: Use the formulas above to see where you stand.
- Benchmark against competitors: Use Share of Voice to see your market position.
- Set SMART goals: Don’t just “want more engagement.” Aim for a 15% increase in comments over the next 90 days.
- Review your tech stack: Ensure you have the tools to track attribution, not just likes.

Ready to stop guessing and start growing? Whether you’re a founder or a marketing operator, the key to success is clarity and structure. Let’s build a system that works for you.


")