Why Perceptual Map Examples Are the Fastest Way to Understand Your Market Position
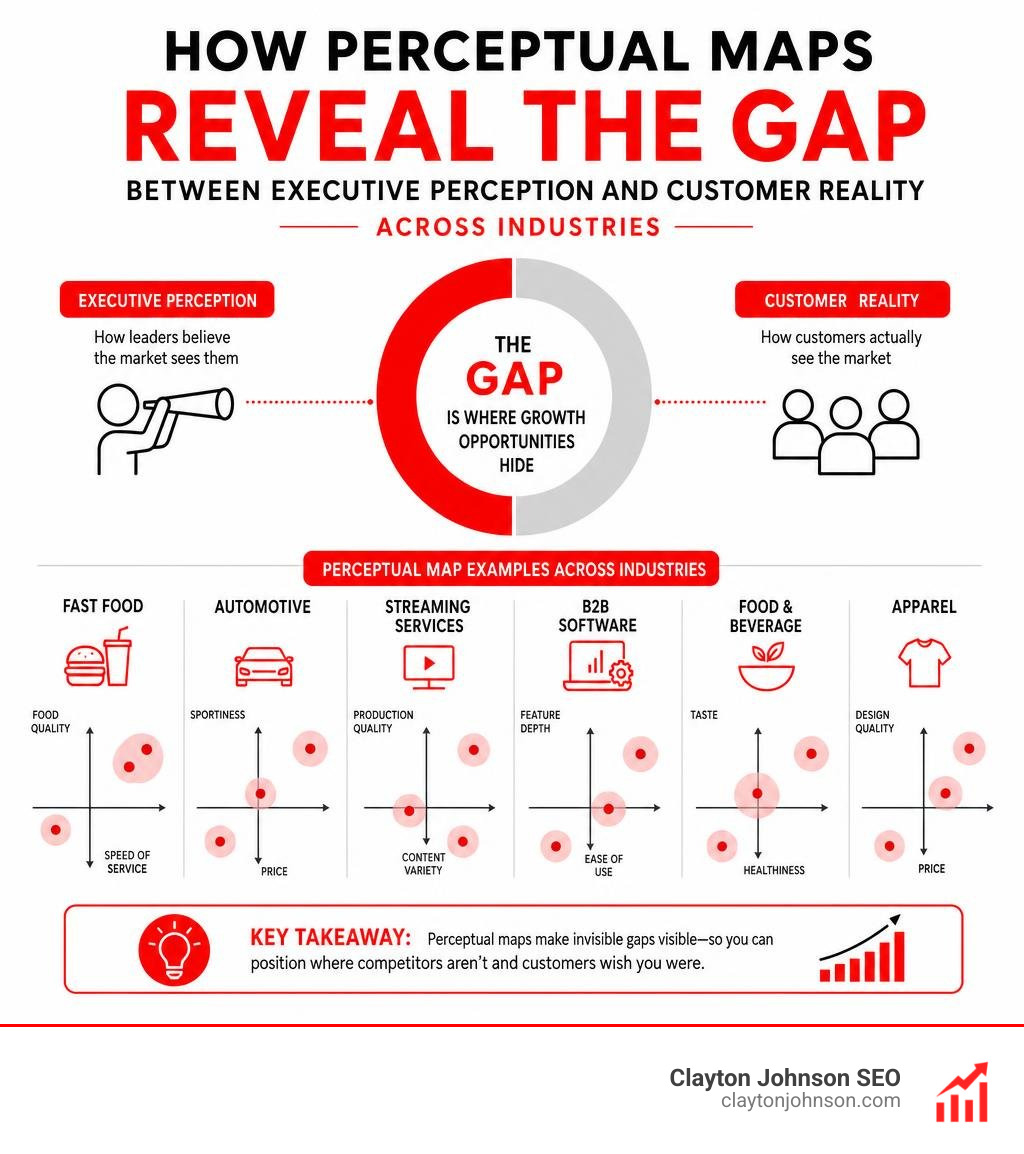
A perceptual map example shows you exactly how customers see your brand compared to competitors — often in a way that surprises even experienced business owners.
Here are some of the most common perceptual map examples used across industries:
| Industry | X-Axis | Y-Axis | What It Reveals |
|---|---|---|---|
| Fast Food | Speed of Service | Food Quality | Who owns the “fast and good” space |
| Automotive | Price | Sportiness | Underserved performance-value gaps |
| Streaming Services | Content Variety | Production Quality | Where new entrants can compete |
| B2B Software | Ease of Use | Feature Depth | Premium pricing opportunities |
| Food and Beverage | Healthiness | Taste | Untapped healthy-but-delicious niches |
| Apparel | Price | Design Quality | Affordable-premium positioning gaps |
This matters more than most business owners realize. Research shows that 80% of CEOs believe they deliver a superior customer experience — yet only 8% of their customers agree. That gap between how you see your brand and how the market actually perceives it is exactly what perceptual mapping is designed to expose.
I’m Clayton Johnson, an SEO strategist and founder of SmallBizSEO, and I’ve spent over a decade helping businesses use competitive intelligence tools — including perceptual mapping — to find positioning gaps and build stronger brand authority. In this guide, I’ll walk you through real perceptual map examples across multiple industries so you can apply the same thinking to your own market.
Basic perceptual map example glossary:
Understanding Perceptual Mapping: Definitions, Components, and Types
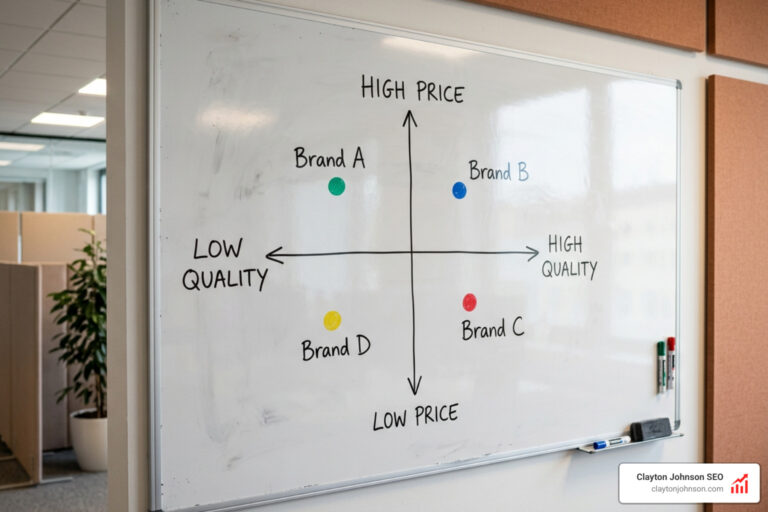
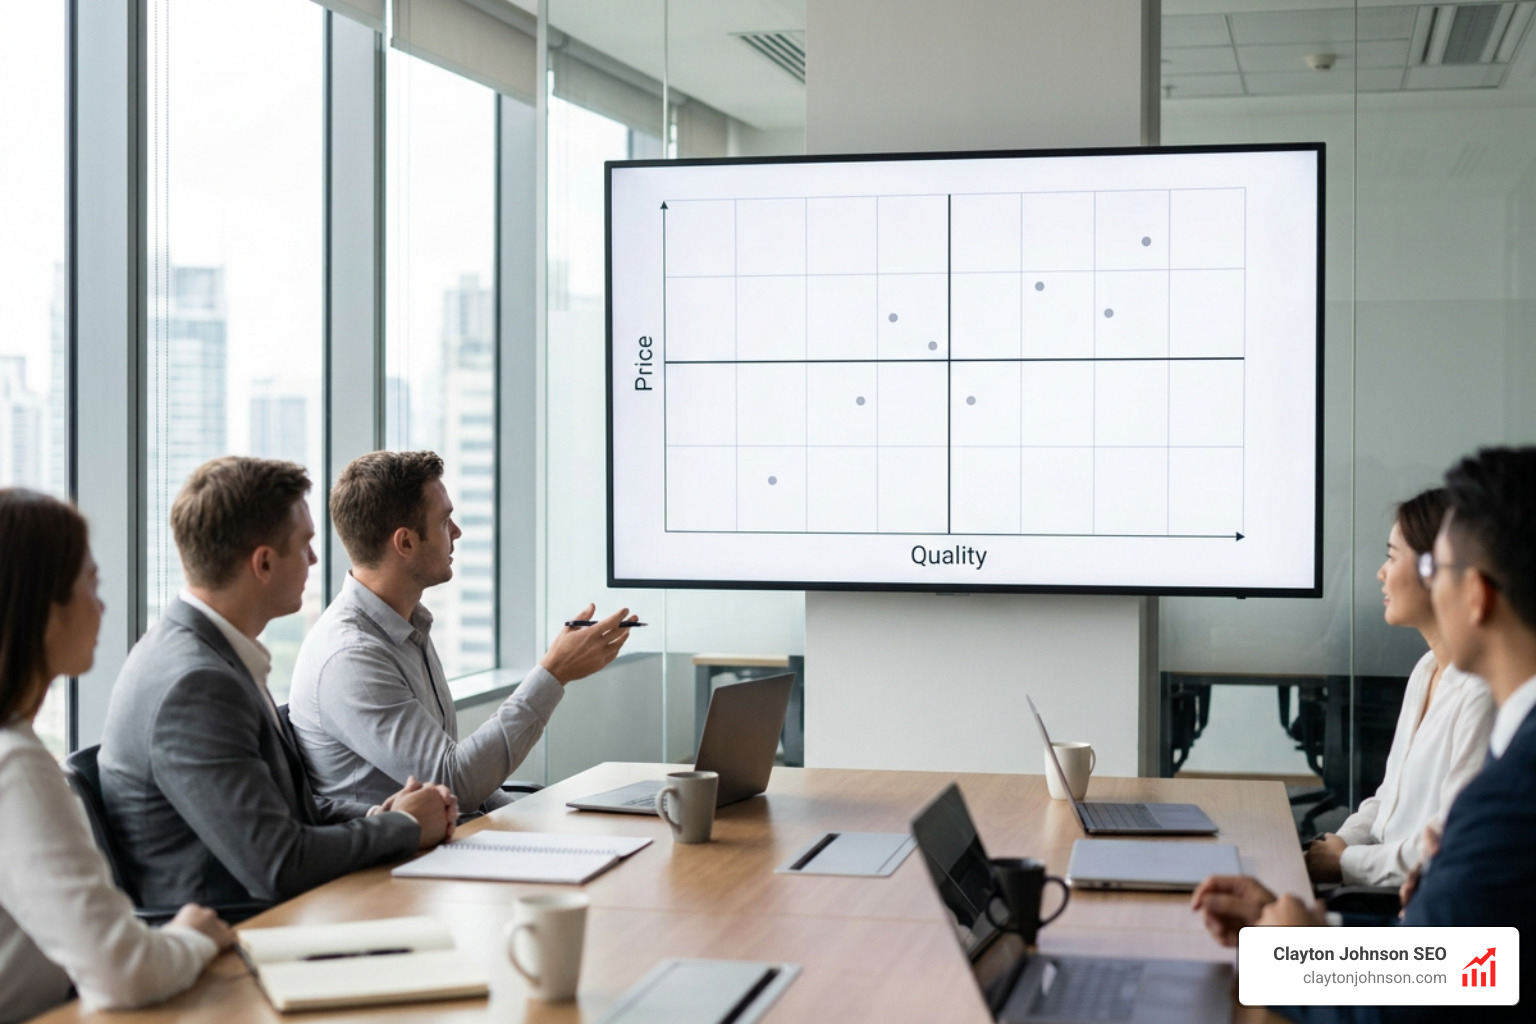
To build a strategy that successfully differentiates your brand, we must first understand what a perceptual map actually is. At its core, a perceptual map is a visual diagram that plots how your target customers perceive your brand relative to your competitors. It is not built on internal balance sheets, feature checklists, or executive assumptions. Instead, it is built entirely on customer psychology and subjective consumer feedback.
Many marketers confuse perceptual maps with other strategic frameworks. Let’s clarify these differences to ensure your team is using the right tool for the right job.
Perceptual Map vs. Positioning Map
While these terms are frequently used interchangeably in marketing meetings, they have distinct definitions:
- A perceptual map reflects how consumers actually perceive your brand and competitors based on empirical market research and survey data.
- A positioning map represents how a company wants to be perceived strategically. It reflects your internal aspirations and future brand goals.
When we look at the ultimate guide to market positioning models, we see that comparing where you actually sit (perceptual map) against where you want to sit (positioning map) is where strategic breakthroughs happen.
| Feature | Perceptual Map | Positioning Map |
|---|---|---|
| Data Source | External consumer surveys and reviews | Internal strategic planning and brand goals |
| Perspective | The customer’s subjective reality | The company’s future vision |
| Primary Use | Identifying current market gaps and sentiment | Planning future product launches and campaigns |
| Dynamic Nature | Changes as consumer sentiment shifts | Changes when leadership updates the brand strategy |
Key Components of a Perceptual Map
To build any perceptual map example, you need to understand its core components:
- The Axes (Determinate Attributes): These are the horizontal (X) and vertical (Y) lines that divide your map into four quadrants. They must represent determinate attributes — the specific characteristics that actually drive a customer’s buying decisions (e.g., price, quality, ease of use, or healthiness).
- The Competitor Set: These are the direct and indirect competitor brands plotted on the grid.
- The Brand Positions: The physical coordinates where each brand is placed based on consumer rating averages.
To dive deeper into how these visual quadrants help you plan, check out our guide on how the competitive positioning map demystified can transform your marketing.
Advanced Mapping: Multidimensional Scaling and Strategic Group Maps
For simple analysis, a two-dimensional, two-axis map is perfect. However, markets are rarely simple.
- Multidimensional Scaling (MDS): This statistical technique takes complex consumer similarity ratings across many different variables and mathematically converts them into a visual representation. Instead of choosing just two attributes, MDS lets you look at how brands cluster based on a holistic view of consumer sentiment.
- Strategic Group Maps: Unlike perceptual maps, which measure customer psychology, strategic group maps measure operational reality. They plot competitors based on objective data like revenue, geographic footprint, or store count.
By comparing your strategic group map (what competitors are doing) with your perceptual map (what customers actually notice), you can identify massive opportunities. This dual approach is your primary defense against commoditization — the dangerous point where customers perceive all products in a category to be identical, leaving price as the only deciding factor.
Real-World Perceptual Map Example Scenarios Across Industries
Looking at a blank grid is rarely inspiring. To help you visualize how this works in practice, let’s explore real-world perceptual map examples across different industries. These examples show how visualizing your competitive landscape can help you protect your market share and carve out a unique angle for your business.
When analyzing these industries, we often look at how brands position themselves to avoid direct competition. To get a broader view of how to map your market, check out our guide on surveying the field with a competitive landscape map.
Fast Food Industry Perceptual Map Example
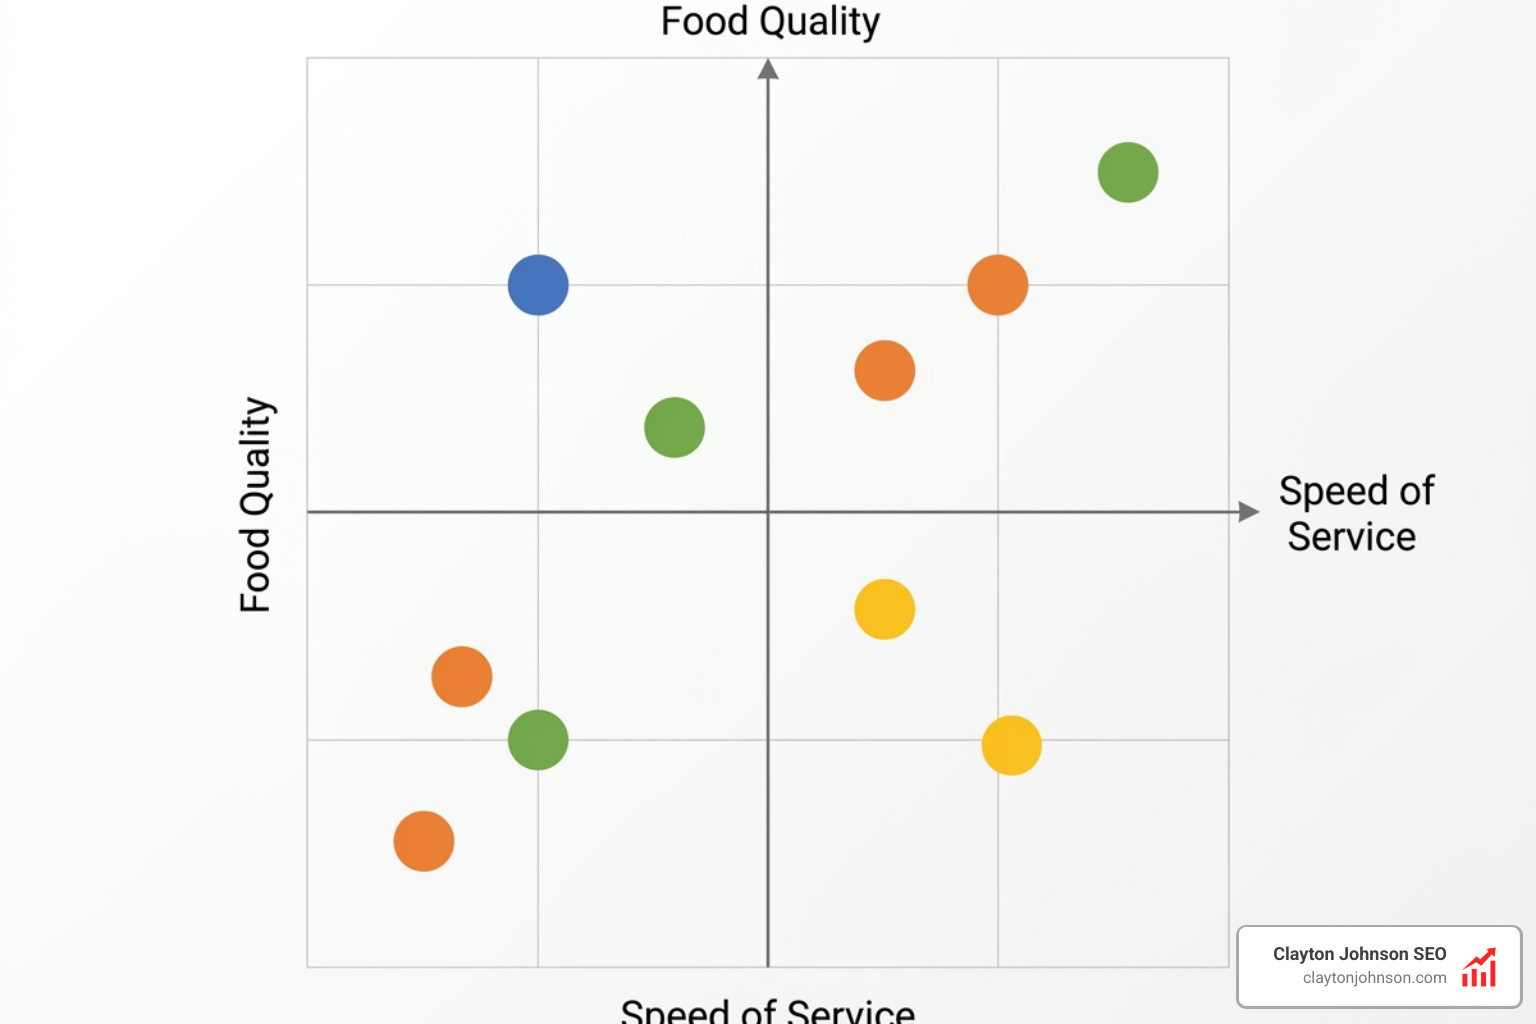
In the quick-service restaurant (QSR) industry, brands constantly battle for different segments of consumer cravings. If we construct a map using healthiness vs. taste or speed of service vs. menu diversity, we get a clear picture of the market:
- The “Fast and Cheap” Quadrant: Legacy brands like McDonald’s and Burger King sit firmly here. They dominate on speed of service and affordability, but score lower on perceived healthiness.
- The “Healthy and Premium” Quadrant: Brands like Subway or local salad chains occupy this space. They trade speed and ultra-low pricing for a health-conscious consumer perception.
- The Market Gap: A brand might look at this and see a gap for “healthy, fast, and highly flavorful” options, which is exactly how fast-casual brands like Chipotle carved out their massive market share.
For a highly specific visualization of this industry, you can check out the Food Brand Perception Map | Creately template to see how different dining options cluster in the consumer’s mind.
Automotive Industry Perceptual Map Example
The automotive market is a classic case study for perceptual mapping. If we map car brands using price vs. sportiness, distinct groups emerge:
- High Price / High Sportiness: Porsche, Ferrari, and Aston Martin. They own the luxury performance space.
- Low Price / Low Sportiness: Budget-friendly, highly reliable commuter options like Toyota and Honda.
- High Price / Low Sportiness: Ultra-luxury passenger vehicles like Rolls-Royce or high-end Mercedes-Benz sedans, which prioritize luxury service and customer experience over raw track speed.
As we look at market trends in July 2026, we see traditional brands being aggressively repositioned by electric vehicle (EV) startups. A legacy brand that used to be perceived as “highly innovative” might now be viewed as “slow and traditional” in the minds of modern, eco-conscious buyers.
Streaming Services and B2B Software Examples
The digital world moves incredibly fast, making perceptual mapping essential for tech companies.
- Streaming Services: If you map streaming giants using entertainment quality (serious vs. light) and content variety, you see Netflix sitting in the high-variety, broad-entertainment space. Meanwhile, niche platforms like Criterion Channel sit in the high-seriousness, curated-variety corner.
- B2B Software: For software platforms, the most common axes are ease of use vs. feature depth.
According to the strategic insights in “Perceptual Mapping: How to Position Your Brand (With Examples)”, many B2B software companies make the mistake of trying to be everything to everyone. They end up in the crowded, confusing middle. The most successful software brands choose a corner: they are either incredibly deep and complex (aimed at enterprise teams) or beautifully simple and fast to adopt (aimed at small businesses).
How to Create a Perceptual Map: A Step-by-Step Guide
Ready to build your own? Creating a data-driven perceptual map requires a structured approach. If you rely on your internal team’s assumptions to place the dots, you will end up with a flattering map that is strategically useless.
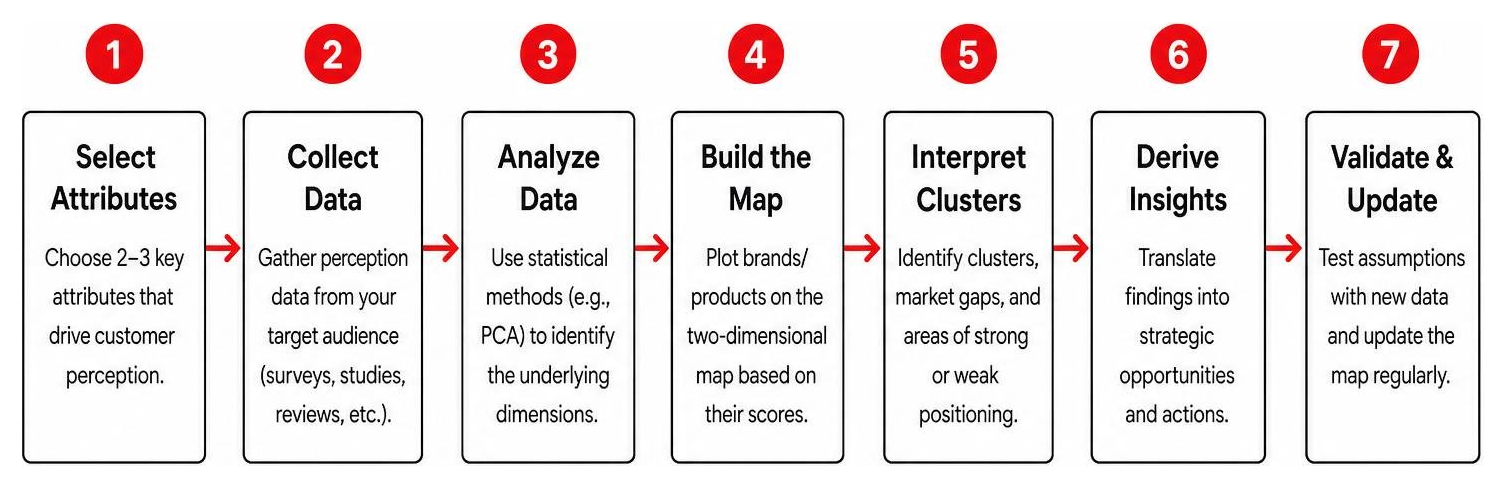
To help you get started, we recommend using collaborative frameworks. You can easily jumpstart this process by downloading the Free Perceptual Map Template: Steps, Tips & Examples [2025] • Asana or using the collaborative Perceptual Map Template | Free Customizable Example | FigJam. If you want to use advanced statistical models, you can leverage the Perceptual Mapping Tool by 1749.io for Principal Component Analysis (PCA) or use the interactive Perceptual Map Tool to quickly build and download your chart.
For a comprehensive strategic overview, read our guide on how to map your way to the top with competition mapping.
Step 1: Select Your Determinate Attributes
Your map is only as good as its axes. You must select two attributes that genuinely drive customer psychology and buying criteria in your industry.
- Avoid Vanity Axes: Do not use “high quality vs. low quality” or “good service vs. bad service.” No brand wants to position itself as “bad,” and customers rarely think in such black-and-white terms.
- Focus on Non-Price Differentiation: While price is a common axis, try mapping your competitors using purely non-price variables (e.g., “convenience vs. customization” or “traditional vs. modern”) to uncover hidden emotional drivers.
Step 2: Define Your Competitive Set and Gather Data
Next, identify the competitors you want to analyze. We recommend including at least 10 competitors to get a complete, unbiased view of the landscape. Be sure to include:
- Direct Competitors: Brands offering the same product to the same audience.
- Substitute Players / Indirect Competitors: Alternative solutions your customers might use to solve their problems (e.g., a movie theater’s competitor isn’t just other theaters; it’s also Netflix or video games).
Once your competitive set is defined, gather real survey data. Ask a representative sample of your target audience (at least 50 to 100 respondents) to rate each brand on a scale of 1 to 10 for your chosen attributes.
Step 3: Plot the Brands and Identify Market Gaps
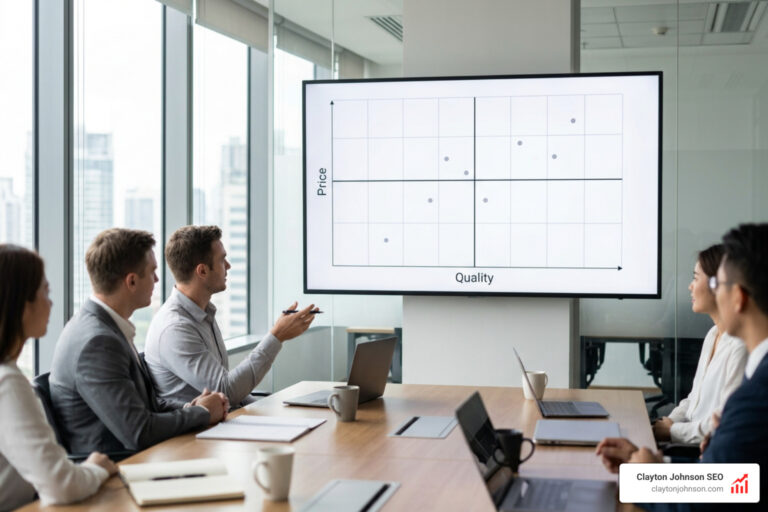
Average the survey scores for each brand and plot them on your grid. You can do this easily in an Excel scatter plot or on a digital whiteboard. Once the dots are on the map, look for the “white space” — areas of the grid that are completely empty.
- Repositioning Strategies: If your current brand position is crowded by larger competitors, you may need to plan a repositioning move toward an open quadrant.
- Me-Too Positioning: Alternatively, you might choose a deliberate “me-too” strategy. This is where a smaller brand intentionally positions itself extremely close to a market leader to draft off their established brand equity.
To make sure your brand stands out rather than blending into the background, check out our guide on how to stop blending in a guide to developing and establishing a brand positioning.
Frequently Asked Questions About Perceptual Mapping
How often should a perceptual map be updated?
At a minimum, you should update your perceptual map once a year. However, significant market shifts require immediate revisions. If a major competitor launches a massive new marketing campaign, rolls out a disruptive product update, or changes their pricing structure, consumer sentiment can shift overnight. Keeping your map updated in July 2026 ensures your strategic content and SEO efforts remain aligned with current consumer reality.
What is the difference between a perceptual map and a strategic group map?
A strategic group map displays the operational reality of a market based on objective, measurable data points (such as annual revenue, number of retail locations, or product features). A perceptual map, on the other hand, measures subjective customer perception based on market research surveys. The gap between these two maps is highly valuable: it shows you what your competitors are actually doing versus what customers actually notice.
Can a small business benefit from perceptual mapping?
Absolutely. In fact, small businesses often benefit the most from perceptual mapping because they have tighter budget constraints and cannot afford to compete head-to-head with giant, venture-backed brands. By mapping their niche markets, small businesses can identify highly specific, underserved customer needs and avoid crowded competitive spaces entirely.
Conclusion
Understanding where your brand sits in the mind of your customer is the absolute foundation of a successful business. Without a clear, data-driven view of your market position, your marketing campaigns, product development, and SEO efforts are just guessing.
At Clayton Johnson SEO, we help companies map, understand, and capture their target audiences through strategic content and data-driven SEO services. By identifying the exact search intent and positioning gaps in your industry, we build content strategies that help you claim your competitive edge.
Ready to stop guessing and start dominating your market? Read our complete guide on how to get your competitive positioning map demystified, and let’s build a strategy that gets your brand noticed.